
Top 100 packaging companies in the USA: how to audit rankings, plant footprints and M&A goodwill
Key Takeaways
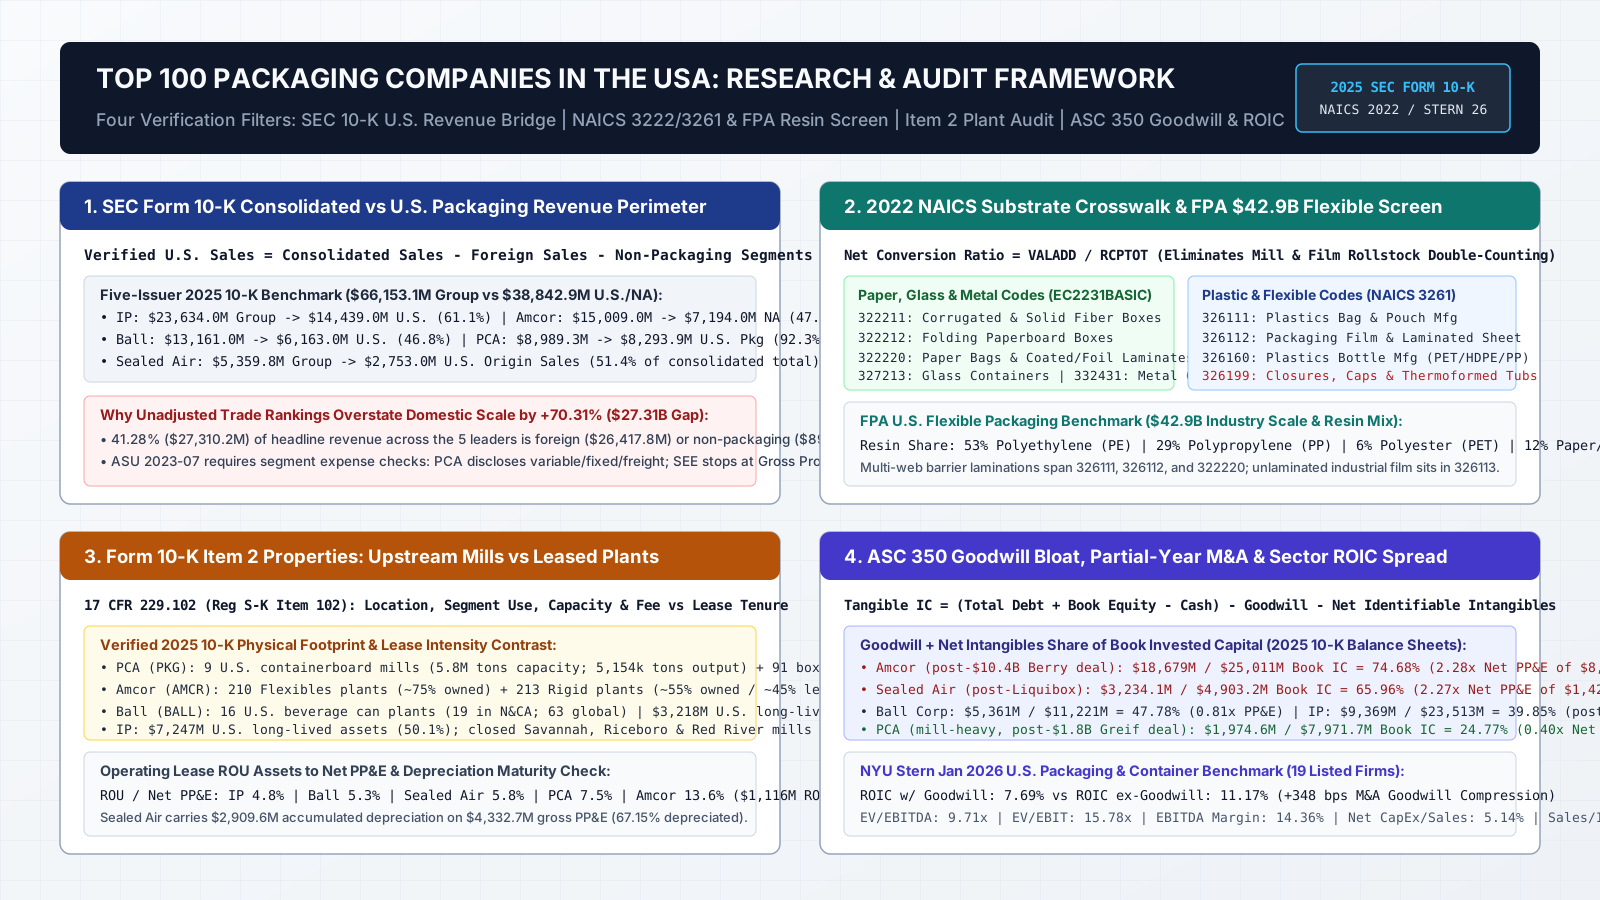
- Across five benchmark SEC filers (International Paper, Amcor, Ball, Packaging Corporation of America and Sealed Air), 2025 consolidated group revenue totals $66,153.1 million ($66.15 billion), whereas disclosed U.S. or North American packaging revenue totals $38,842.9 million ($38.84 billion, or 58.72%), leaving $27,310.2 million (41.28%) in foreign operations and non-packaging segments.
- Screening the largest plastic packaging companies and top flexible packaging companies in the USA requires combining 2022 NAICS codes 326111 (bags and pouches), 326112 (packaging film and laminated sheet), 322220 (coated paper and foil bags) and 326160 (plastic bottles) while checking Census Value Added (VALADD) against Value of Shipments (RCPTOT) to eliminate resin and rollstock double-counting.
- In the Flexible Packaging Association (FPA) benchmark for the $42.9 billion U.S. flexible packaging sector, polymer consumption splits across polyethylene (53% PE), polypropylene (29% PP) and polyester (6% PET), with paper, aluminum foil, polyamide and EVOH barrier layers making up the remaining 12%.
- Form 10-K Item 2 (17 CFR 229.102) separates asset-heavy mill owners such as PCA (9 U.S. containerboard mills with 5.8 million tons capacity and 91 corrugated plants at a 7.5% operating-lease ROU-to-PP&E ratio) from converter networks such as Amcor (423 global facilities, with 45% of rigid blow-molding plants leased near customer filling lines and a 13.6% ROU-to-PP&E ratio).
- Roll-up acquisitions load plastic and flexible converter balance sheets with ASC 350 goodwill and customer intangibles equal to 74.68% of book invested capital at Amcor ($18,679.0M, or 2.28x Net PP&E) and 65.96% at Sealed Air ($3,234.1M, or 2.27x Net PP&E), explaining why NYU Stern's January 2026 U.S. Packaging and Container sector ROIC jumps from 7.69% with goodwill to 11.17% excluding goodwill.
Research Scope
- Regions
- United States domestic establishment statistics (2022 NAICS / Economic Census EC2231BASIC) and U.S. versus global geographic disclosures in SEC Form 10-K filings.
- Period
- 2025 SEC Form 10-K filings (periods ended June 30, 2025 and December 31, 2025, filed August 2025 to March 2026); 2022 NAICS and Economic Census definitions; NYU Stern January 2026 U.S. sector benchmarks; checked October 26, 2026.
- Industries
- Paperboard containers (NAICS 322211, 322212, 322219), coated paper and bags (322220), plastic bags, pouches and laminated flexible packaging film (326111, 326112), rigid plastic bottles (326160), glass containers (327213) and metal cans (332431).
- Data objects
- Consolidated group revenue, ASC 280 external segment revenue, ASU 2023-07 significant segment expenses, ASC 280-10-50-41 U.S. origin revenue and long-lived tangible assets, Item 2 plant counts and lease ratios, ASC 805/350 goodwill and acquired intangibles, and Census RCPTOT versus VALADD.
Relying on commercial trade-magazine lists of the top 100 packaging companies in the USA without auditing their accounting boundaries causes severe peer-group errors and wastes research time. A defensible domestic packaging screen reconciles consolidated group sales to ASC 280-10-50-41 U.S. origin packaging revenue in SEC Form 10-K filings, maps converter plants to six-digit 2022 NAICS substrate codes (3222 and 3261), verifies physical mills versus leased converting bays under Regulation S-K Item 102, and strips ASC 350 merger goodwill from invested capital.
Across five benchmark SEC packaging filers (International Paper, Amcor, Ball Corporation, Packaging Corporation of America and Sealed Air), 2025 consolidated group sales total $66,153.1 million ($66.15 billion), whereas disclosed U.S. or North American packaging sales total $38,842.9 million ($38.84 billion, or 58.72%). Exactly $27,310.2 million (41.28% of the headline sum, or a +70.31% overstatement of the domestic perimeter) comes from foreign operations ($26,417.8 million) and non-packaging paper or logistics segments ($892.4 million). Use this guide alongside our packaging company classification framework, the packaging industry research hub and the primary data sources directory to audit every row in a domestic packaging screen.
Scroll horizontally to view all columns.
| Audit dimension | Primary SEC or statistical locator | Core verification formula or rule | Dominant ranking failure mode |
|---|---|---|---|
| 1. Domestic packaging revenue perimeter | Form 10-K Item 8 segment note (ASC 280-10-50-41) | Verified_US_Pkg_Sales = Consolidated_Sales - Non_Pkg_Segments - Foreign_Sales - Intersegment_Sales |
Ranking U.S.-headquartered or dual-listed multinationals on global group sales, which overstates the 5-company domestic perimeter by $27,310.2M (+70.31%) |
| 2. ASU 2023-07 segment cost boundary | Form 10-K segment footnote significant expense lines | Compare CODM-disclosed cost categories (variable, fixed, freight, SG&A, D&A) before comparing segment margins | Treating Sealed Air’s Segment Gross Profit (30.56% Food, 28.55% Protective before $744.9M unallocated SG&A) as equivalent to PCA’s GAAP segment operating income (13.57%) |
| 3. NAICS 3222 / 3261 substrate and value-added screen | 2022 Economic Census EC2231BASIC, ASM methodology and FPA industry reports | Net_Conversion_Share_Pct = (VALADD / RCPTOT) * 100 across 6-digit converter codes |
Summing Value of Shipments (RCPTOT) across upstream board mills (322130) and box plants (322211), or missing rigid closures (326199) outside plastic bottles (326160) |
| 4. Item 2 physical plant and lease audit | Form 10-K Item 1 and Item 2 Properties (17 CFR 229.102) and lease footnote | Lease_Intensity_Pct = (Operating_Lease_ROU_Assets / Net_PPE) * 100 and Accum_Depr / Gross_PPE |
Equating a converter leasing 45% of its blow-molding bays (Amcor Rigid) with an integrated producer owning 9 U.S. containerboard mills (PCA, 5.8M tons capacity) |
| 5. ASC 350 M&A goodwill bloat and ROIC adjustment | Form 10-K balance sheet, acquisition note (ASC 805) and goodwill note (ASC 350-20) | Tangible_IC = Book_Invested_Capital - Goodwill - Identifiable_Intangibles_Net |
Judging asset scale or capital returns on unadjusted book capital when goodwill and intangibles make up 74.68% of book invested capital at Amcor and 65.96% at Sealed Air |
SEC 10-K segment and domestic revenue bridges across five major filers
Trade-publication rankings of the top 100 packaging companies in the USA routinely commingle five incompatible metrics inside a single revenue column:
- Global consolidated revenue of U.S.-listed multinationals that earn roughly half of their sales in Europe, Latin America and Asia Pacific.
- Wider regional reportable segments such as “North and Central America” or “Americas” that bundle Canadian, Mexican and South American converting plants into the domestic total.
- Non-packaging business units such as communication paper (
$615.4 millionat PCA), market pulp (International Paper’s divested Global Cellulose Fibers division) or third-party rail and trucking logistics ($80.0 millionat PCA). - Partial-year revenue from mid-year mergers paired with 100% of the acquired target’s year-end balance sheet (such as Amcor’s April 30, 2025 merger with Berry Global Group, Inc. and PCA’s September 2, 2025 acquisition of the Greif containerboard business).
- Unaudited broker or private-equity revenue estimates for closely held roll-up converters that file no public financial statements.
Under U.S. GAAP, FASB ASC 280-10 (Segment Reporting) provides two separate footnote tables that resolve the revenue boundary for public issuers. First, the reportable segment table (ASC 280-10-50-22) isolates external customer sales by operating segment after eliminating intersegment transfers. Second, the entity-wide geographic disaggregation table (ASC 280-10-50-41) requires registrants to disclose external revenues attributed to the entity’s country of domicile (or principal country of operations) separately from all foreign countries, alongside long-lived tangible assets by country.
Applying both ASC 280 filters yields the domestic packaging revenue isolation identity:
Verified_US_Packaging_Revenue = Consolidated_Group_Revenue - Non_Packaging_Segment_Revenue - Non_US_International_Revenue - Intersegment_EliminationsRanking_Overstatement_Pct = ((Headline_Group_Revenue - Disclosed_US_or_NA_Packaging_Revenue) / Disclosed_US_or_NA_Packaging_Revenue) * 100The benchmark table below reconciles 2025 SEC Form 10-K consolidated net sales to disclosed U.S. (or North American for Amcor) packaging sales across five leading U.S.-listed issuers spanning corrugated paperboard, flexible and rigid plastics, and metal beverage cans.
Scroll horizontally to view all columns.
| Company and 2025 Form 10-K period | Primary substrates and 2022 NAICS codes | Consolidated group sales ($M) | Disclosed packaging segment external sales ($M) | Disclosed U.S. or NA packaging revenue ($M) | U.S. / NA share of group sales (%) | Foreign and non-packaging gap ($M) | Dominant ranking distortion verified in 2025 Form 10-K |
|---|---|---|---|---|---|---|---|
| International Paper Company (IP); FY ended Dec 31, 2025 (filed Feb 27, 2026) | Corrugated boxes and containerboard (322211, 322130) |
$23,634.0 | $23,437.0 ($14,987.0M PS North America + $8,450.0M PS EMEA; excludes $197.0M Other and discontinued Global Cellulose Fibers pulp) |
$14,439.0 (U.S. origin net sales, Note 21 p. 116, including $965.0M exports; PS NA segment is $14,987.0M) |
61.10% | $9,195.0 | Includes $8,450.0M of EMEA sales enlarged by the 2025 DS Smith acquisition, $745.0M of non-U.S. Americas/Asia sales and $197.0M of Other sales; $965.0M of U.S. origin sales are exports |
| Amcor plc (AMCR); FY ended June 30, 2025 (filed Aug 2025) | Flexible film/pouches (326111, 326112), specialty cartons (322212), rigid plastic bottles and closures (326160, 326199) |
$15,009.0 | $15,009.0 ($10,872.0M Global Flexible Packaging Solutions + $4,137.0M Global Rigid Packaging Solutions) |
$7,194.0 (North America net sales: $4,429.0M Flexibles + $2,765.0M Rigid, Note 21 p. 109; U.S. net PP&E is $3,872.0M or 47.21% of global PP&E) |
47.93% | $7,815.0 | 52.07% ($7,815.0M) of revenue originates in Europe ($4,321.0M), Latin America ($1,790.0M) and Asia Pacific ($1,704.0M); Berry Global merger closed April 30, 2025, adding only 2 months ($1,591.0M) to FY25 sales |
| Ball Corporation (BALL); FY ended Dec 31, 2025 (filed Feb 19, 2026) | Aluminum beverage cans, ends and aerosol containers (332431) |
$13,161.0 | $12,431.0 reportable beverage can segments ($6,286.0M N&CA, $3,983.0M EMEA, $2,162.0M South America) + $730.0M Other (Asia cans, aerosol/slugs) |
$6,163.0 (U.S. origin net sales, Note 3 p. 51; $123.0M below the $6,286.0M North & Central America segment) |
46.83% | $6,998.0 | 53.17% ($6,998.0M) of consolidated sales originate outside the U.S. (Brazil $1,494.0M, EMEA and other foreign countries $5,504.0M); N&CA segment includes 2 plants in Mexico and 1 in Canada |
| Packaging Corporation of America (PKG); FY ended Dec 31, 2025 (filed Feb 26, 2026) | Corrugated shipping containers and containerboard (322211, 322130) |
$8,989.3 | $8,293.9 (Packaging segment external trade sales, Note 19 p. 72; excludes $615.4M Paper segment UFS office paper and $80.0M Corporate logistics) |
$8,293.9 (U.S. Packaging segment external trade sales; PCA operates primarily in the U.S. with no significant foreign long-lived assets) | 92.26% | $695.4 | Group total includes $615.4M of non-packaging uncoated freesheet (UFS) communication paper and $80.0M of third-party rail/trucking revenue (plus $154.1M eliminated intersegment freight) |
| Sealed Air Corporation (SEE); FY ended Dec 31, 2025 (filed Mar 2, 2026) | Barrier food bags/pouches and shrink film (326111, 326112), protective plastic/foam (326112, 326140) |
$5,359.8 | $5,359.8 ($3,594.7M Food segment [67.1%] + $1,765.1M Protective segment [32.9%], Note 6 p. 88) |
$2,753.0 (U.S. origin net sales, Note 6 p. 90; $677.8M below Americas net sales of $3,430.8M) |
51.36% | $2,606.8 | 48.64% ($2,606.8M) of sales occur outside the U.S. (EMEA $1,172.7M, APAC $756.3M, non-U.S. Americas $677.8M); CODM evaluates segments on Gross Profit ($1,602.4M) rather than EBIT |
| Five-company 2025 10-K total | Multi-substrate benchmark perimeter | $66,153.1 | $64,530.7 reportable packaging segments | $38,842.9 | 58.72% | $27,310.2 | Headline group sum overstates the $38,842.9M U.S./NA packaging perimeter by +70.31% ($26,417.8M foreign + $892.4M non-packaging) |
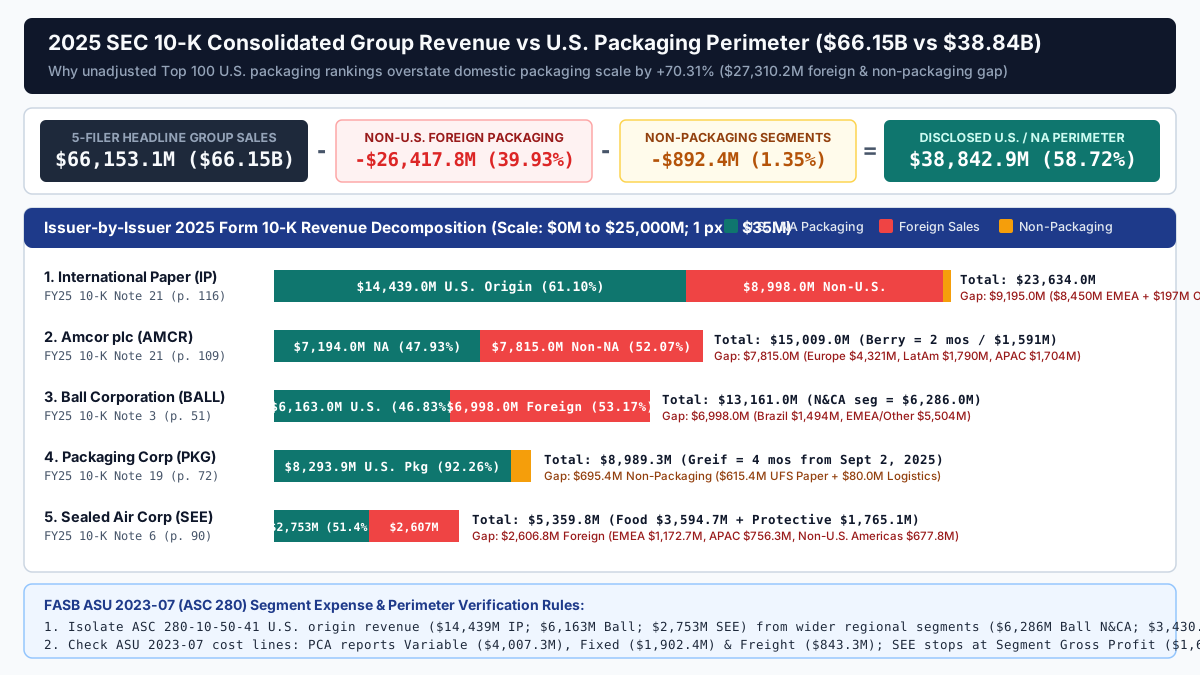
Notice how the domestic perimeter changes relative company scale inside a U.S. screen:
- Domestic concentration flips rank order between Ball and PCA: On a global consolidated basis, Ball Corporation (
$13,161.0 million) appears46.4%larger than Packaging Corporation of America ($8,989.3 million). Once foreign beverage can sales ($6,998.0 millionin EMEA, Brazil and other countries) are removed from Ball and non-packaging UFS communication paper and logistics ($695.4 million) are removed from PCA, PCA’s domestic packaging revenue ($8,293.9 million) exceeds Ball’s U.S. origin revenue ($6,163.0 million) by$2,130.9 million(+34.6%). - Discontinued operations and divestitures alter multi-year baselines: In International Paper’s 2025 Form 10-K (Item 1, p. 1), IP completed its acquisition of European corrugated leader DS Smith while reclassifying its Global Cellulose Fibers (fluff and market pulp) business to discontinued operations ahead of its
$1.5 billionsale on January 23, 2026 ($1,800 millionof assets held for sale on the December 31, 2025 balance sheet). Even within IP’s$14,439.0 millionof U.S. geographic net sales (Note 21, p. 116),$965.0 millionconsists of export shipments, leaving$13,474.0 millionof domestic U.S. destination sales. - ASU 2023-07 exposes incompatible segment expense structures: Effective for fiscal years beginning after December 15, 2023, FASB ASU 2023-07 requires registrants to disclose significant segment expense categories regularly reviewed by the Chief Operating Decision Maker (CODM). In 2025 Form 10-K filings, PCA Note 19 (p. 72) disaggregates its
$7,168.6 millionof Packaging segment expenses (on$8,293.9 millionexternal sales) into Variable costs ($4,007.3 million, or48.32%of sales), Fixed costs ($1,902.4 million, or22.94%), Freight ($843.3 million, or10.17%) and Other segment items ($415.6 million, or5.01%), leaving$1,125.3 million(13.57%) of GAAP segment operating income. By contrast, International Paper Note 21 (p. 113) breaks Packaging Solutions North America expenses ($14,603.0 millionon$15,175.0 milliontotal segment revenue including$188.0 millionintersegment) into Cost of products sold ($10,338.0 million), SG&A ($1,293.0 million), D&A ($1,724.0 million), Distribution ($1,125.0 million) and Other ($123.0 million) for a$572.0 million(3.82%of external sales) segment profit. Meanwhile, Sealed Air Note 6 (p. 88) reports only Cost of sales ($2,496.2 millionFood;$1,261.2 millionProtective) to arrive at Segment Gross Profit ($1,098.5 millionor30.56%in Food;$503.9 millionor28.55%in Protective), leaving$744.9 millionof SG&A,$59.5 millionof intangible amortization and$39.9 millionof restructuring unallocated below segment gross profit. As shown in our largest packaging companies segment breakdown, Amcor Note 21 (p. 106) and Ball Note 3 (p. 52) disclose a single consolidated segment expense line because their CODMs review only consolidated expense totals.
Rule of thumb: if an issuer’s ASC 280-10-50-41 geographic table reports only a multi-country region (such as Amcor’s $7,194.0 million North America revenue), cross-check the U.S. share of net long-lived tangible assets ($3,872.0 million U.S. net PP&E out of $8,202.0 million global net PP&E, or 47.21% at Amcor) and label the revenue line as North American rather than U.S.-only.
Takeaway: Strip foreign operations and non-packaging segments using the ASC 280 segment and geographic tables before ranking any issuer in a U.S. packaging peer group.
NAICS 3222 and 3261 substrate codes for plastic and flexible converters
Researchers screening for the largest plastic packaging companies or the top flexible packaging companies in the USA encounter a second structural boundary: the North American Industry Classification System (NAICS) has no unified “packaging” sector and no single code for flexible packaging. In the U.S. Census Bureau’s 2022 Economic Census Manufacturing Summary Statistics (EC2231BASIC) and 2022 NAICS code lists, packaging converters are divided by primary material conversion process across Subsector 322 (Paper Manufacturing), Subsector 326 (Plastics and Rubber Products Manufacturing), Subsector 327 (Nonmetallic Mineral Product Manufacturing) and Subsector 332 (Fabricated Metal Product Manufacturing), while packaging equipment builders sit in 333993 (Packaging Machinery Manufacturing).
Pulling 4-digit industry group totals (3222 Converted Paper Product Manufacturing or 3261 Plastics Product Manufacturing) contaminates a packaging screen because 3222 includes sanitary paper products (toilet tissue, diapers) and office stationery, while 3261 includes PVC construction pipe, plastic floor coverings, automotive trim and industrial geomembranes. A clean U.S. establishment screen must filter at the six-digit 2022 NAICS level and account for three cross-code overlaps:
- Multi-material flexible packaging splits across three six-digit codes: In the Flexible Packaging Association (FPA) industry benchmark, the U.S. flexible packaging industry represents approximately
$42.9 billionin annual domestic sales across food (retail and institutional), medical/pharmaceutical, personal care, pet food and industrial applications. Because flexible pouches, barrier rollstock, shrink bags and lidding webs combine polymer resins with paper and aluminum foil, Census establishments split across326111(Plastics Bag and Pouch Manufacturing),326112(Plastics Packaging Film and Sheet [including Laminated] Manufacturing) and322220(Paper Bag and Coated and Treated Paper Manufacturing, which houses laminated aluminum-foil/paper flexible structures). Within the polymer film and pouch web layer, FPA material consumption is dominated by polyethylene (53% PE, including LDPE, LLDPE and HDPE sealant and shrink webs), polypropylene (29% PP, including BOPP snack webs and cast PP retort films) and polyester (6% PET, primarily BOPET print and lidding substrates), with paper, aluminum foil, polyamide (nylon) and ethylene vinyl alcohol (EVOH) barrier resins comprising the remaining12%. - Rigid plastic packaging splits between bottles (
326160) and closures/thermoforming (326199): When screening the largest plastic packaging companies, NAICS326160(Plastics Bottle Manufacturing) captures blow-molded and injection-stretch blow-molded PET, HDPE and PP bottles and jars. However, threaded plastic closures, dispensing pumps, trigger sprayers, prescription vials and thermoformed plastic food tubs or clamshells are classified inside NAICS326199(All Other Plastics Product Manufacturing), while expanded polystyrene foam protective shapes sit in326140(Polystyrene Foam Product Manufacturing). Following Amcor’s April 30, 2025 acquisition of Berry Global (Amcor 2025 10-K, Note 4, pp. 66-67), Amcor’s$4,137.0 millionGlobal Rigid Packaging Solutions segment and Berry’s legacy U.S. container, closure and dispensing plants span both326160and326199. - Summing Value of Shipments (
RCPTOT) across vertically linked codes double-counts raw rollstock: As documented in the U.S. Census Bureau’s Annual Survey of Manufactures (ASM) Technical Documentation, aggregating total Value of Shipments (RCPTOT) across upstream and downstream NAICS codes double-counts intermediate materials transferred between plants. When a containerboard mill in322130(Paperboard Mills) ships kraftliner and corrugating medium (grades analyzed in paper and packaging board grades and pricing) to a corrugated box plant in322211, or when a film extruder in326112ships unprinted barrier rollstock to a stand-up pouch converter in326111, the rollstock value is counted once at the mill/extruder and a second time inside the finished box or pouch shipment value.
To eliminate inter-plant material duplication in Census EC2231BASIC or ASM tables, evaluate Value Added (VALADD) alongside Value of Shipments (RCPTOT):
VALADD = RCPTOT - CSTMTOT + Ending_WIP_and_Finished_Inventory - Beginning_WIP_and_Finished_InventoryNet_Conversion_Share_Pct = (VALADD / RCPTOT) * 100Here CSTMTOT is the total cost of materials, parts, containers, fuel, purchased electricity and contract work consumed by the establishment, and Net_Conversion_Share_Pct measures the establishment’s net converting margin above purchased resin, paperboard or aluminum sheet inputs (whose price series are tracked in packaging costs and price indexes).
Scroll horizontally to view all columns.
| Substrate family | 2022 NAICS 6-digit code | Official Census EC2231BASIC title | Included U.S. converting establishments and primary outputs | Boundary trap and company segment cross-reference |
|---|---|---|---|---|
| Corrugated shipping containers | 322211 |
Corrugated and Solid Fiber Box Manufacturing | Corrugator and sheet plants converting linerboard and medium into RSC shipping boxes, die-cut mailers, retail displays and honeycomb partitions | Upstream virgin kraftliner and recycled medium mills sit in 322130 (Paperboard Mills). Summing 322130 and 322211 RCPTOT double-counts paperboard rollstock (PCA produces 5,154k tons of board and ships 71.1 BSF of corrugated products) |
| Folding paperboard cartons | 322212 |
Folding Paperboard Box Manufacturing | Plants printing, die-cutting and folding SBS, FBB and coated recycled paperboard (CRB/URB) cartons for food, beverage and personal care | Excludes setup boxes and sanitary liquid food cartons (322219). Amcor reports $1,031.0M of specialty folding cartons inside its $10,872.0M Global Flexible Packaging Solutions segment rather than a paperboard segment |
| Sanitary food & setup paperboard containers | 322219 |
Other Paperboard Container Manufacturing | Liquid-tight milk/juice gable-top and aseptic cartons, paperboard cups, rigid setup boxes and composite fiber cans/drums with metal or plastic ends | Frequently bundled with rigid plastics or metal ends inside diversified converters |
| Paper bags & foil/paper flexible laminates | 322220 |
Paper Bag and Coated and Treated Paper Manufacturing | Multiwall shipping sacks, grocery bags, waxed/coated papers and laminated aluminum-foil/paper flexible packaging webs | Mixed code: includes non-packaging pressure-sensitive tapes, wallpaper and stationery alongside flexible paper-foil barrier laminations |
| Flexible plastic bags & pouches | 326111 |
Plastics Bag and Pouch Manufacturing | Single-web and multi-web polymer bags, stand-up pouches (SUP), barrier meat/cheese shrink bags (such as Sealed Air Cryovac) and heavy-duty sacks | Core code for top flexible packaging companies in USA ($3,594.7M Sealed Air Food; $9,841.0M Amcor flexible films/pouches), but Census totals also include household refuse and retail carryout bags |
| Flexible packaging film & laminated sheet | 326112 |
Plastics Packaging Film and Sheet (including Laminated) Manufacturing | Blown, cast and co-extruded PE, PP and PET packaging films, barrier rollstock, stretch/shrink wrap and multi-layer polymer laminations | Must be separated from 326113 (Unlaminated Plastics Film and Sheet [except Packaging]), which covers construction geomembranes and agricultural/industrial sheet |
| Rigid plastic bottles & jars | 326160 |
Plastics Bottle Manufacturing | Extrusion blow-molded and injection-stretch blow-molded PET, HDPE and PP bottles and jars for beverages, dairy, personal care and household chemicals | Core code for largest plastic packaging companies, but plastic closures, caps, dispensing pumps and thermoformed tubs/clamshells sit in 326199 (All Other Plastics Product Manufacturing) |
| Glass packaging containers | 327213 |
Glass Container Manufacturing | Narrow-neck and wide-mouth glass bottles and jars for beer, spirits, wine, food and pharmaceuticals | High continuous-furnace capital intensity and tight regional freight radius; distinct from flat glass (327211) and pressed glassware (327212) |
| Metal beverage, food & aerosol cans | 332431 |
Metal Can Manufacturing | Two-piece drawn-and-ironed aluminum beverage cans, three-piece steel food cans, aerosol cans and metal lids/ends (Ball’s $13,161.0M global / $6,163.0M U.S. sales) |
Distinct from 332439 (Other Metal Container Manufacturing), which commingles industrial steel drums and IBC totes with toolboxes, lunch boxes and mailboxes |
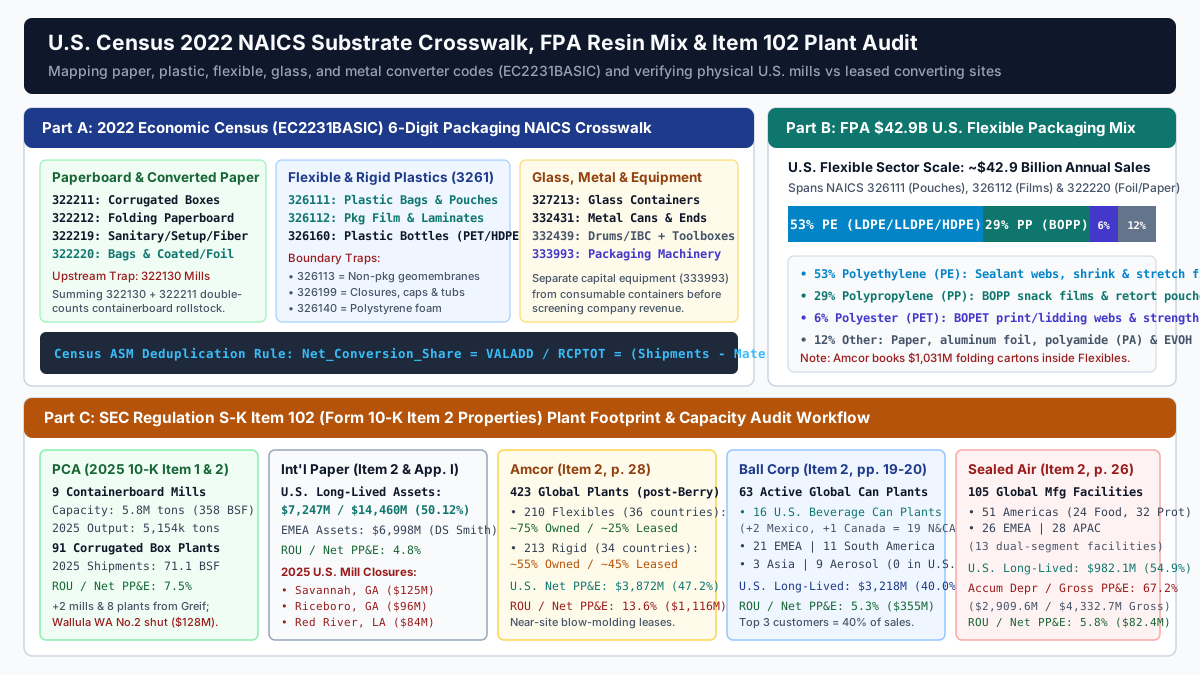
Also keep the statistical unit clear when comparing Census counts against company lists. As defined in the U.S. Census Bureau’s Statistics of U.S. Businesses (SUSB), an establishment (ESTAB) is a single physical manufacturing location assigned one primary six-digit NAICS code based on its dominant output, whereas a firm or enterprise is the legal business organization controlling one or more domestic establishments. A single parent enterprise such as Amcor, International Paper or PCA operates dozens of individual domestic establishments across multiple six-digit NAICS codes.
Takeaway: Build U.S. plastic and flexible packaging screens from six-digit NAICS converter codes (326111, 326112, 326160, 322220) plus 326199 for closures and thermoforming, and use Census Value Added (VALADD) whenever combining upstream mills or extruders with downstream box and pouch plants.
Item 2 plant footprints and capacity audits for mills and converters
Two packaging companies reporting $3.0 billion to $8.0 billion in domestic revenue can possess entirely different physical asset quality, maintenance capital expenditure obligations (see CapEx to-revenue ratio by industry and CapEx versus OpEx), and regional customer lock-in. Under 17 CFR 229.102 (SEC Regulation S-K Item 102, Description of Property), Form 10-K Item 2. Properties (and Item 1 facility tables) requires every registrant to disclose the location and general character of materially important physical properties, identify the reportable segments that use them, and state whether facilities are held in fee (owned) or leased.
Auditing Item 2 alongside the balance sheet and lease footnotes exposes three physical operating metrics that commercial Top 100 directories omit:
Lease_Intensity_Ratio_Pct = (Operating_Lease_ROU_Assets / Net_PPE) * 100PP&E_Depreciation_Maturity_Pct = (Accumulated_Depreciation / Gross_PPE) * 100Domestic_Asset_Concentration_Pct = (US_Long_Lived_Tangible_Assets / Consolidated_Long_Lived_Tangible_Assets) * 100Why do these three ratios separate upstream mill owners from light converting networks?
- Owned upstream mills versus leased near-site blow-molding and sheet plants: Integrated paperboard and metal can manufacturers own heavy continuous-process machinery (Fourdrinier paperboard machines, chemical recovery boilers, lime kilns and high-speed drawn-and-ironed aluminum can lines) that sit on fee-simple industrial land with low operating-lease ratios (
4.8%to7.5%ROU-to-Net-PP&E). By contrast, rigid plastic bottle makers frequently lease blow-molding facilities adjacent to or contiguous with customer beverage and food filling plants (“through-the-wall” or near-site operations) to avoid shipping empty plastic bottles filled with air. In Amcor’s FY2025 Form 10-K (Item 2, p. 28), approximately45%of its 213 Global Rigid Packaging facilities are leased (with initial terms of 2 to 15 years) versus25%leased across its 210 Global Flexible Packaging facilities, lifting Amcor’s operating lease ROU assets to$1,116.0 million(13.61%of its$8,202.0 millionNet PP&E). - Physical tonnage and corrugated shipment verification: Only physical throughput disclosures confirm whether revenue growth came from volume or price/mix (a check paired with packaging industry challenges and slowdown indicators). In PCA’s 2025 Form 10-K (Item 1, pp. 3-5; Item 2, p. 16), PCA discloses 9 U.S. containerboard mills with
5.8 million tons(358 billion square feet [BSF]) of annual capacity that produced5,154 thousand tons(304.9 BSF) of containerboard in 2025, feeding 91 domestic corrugated manufacturing plants (56 combination corrugator plants and 35 sheet/specialty plants) that shipped71.1 BSFof corrugated products. PCA also discloses that net purchased recycled fiber totaled1,150,000 tons(22%of 2025 containerboard production). - Mill closure charges and asset age: Footnote restructuring and depreciation records reveal when a high-ranking producer is retiring older U.S. capacity. In 2025, International Paper recorded closure charges across three U.S. containerboard mills: Savannah, Georgia (
$125.0 million), Riceboro, Georgia ($96.0 million) and Red River, Louisiana ($84.0 million). Similarly, PCA permanently shut down the No. 2 paper machine and kraft pulping facilities at its Wallula, Washington mill in Q4 2025 ($128.0 millionfourth-quarter charge within$205.0 millionof total estimated restructuring costs) while adding two containerboard mills (Massillon, Ohio and Riverville, Virginia,~800,000 tonscombined capacity) and eight corrugated plants via the$1,800.5 millionGreif containerboard acquisition on September 2, 2025. At Sealed Air (Note 8, p. 91), accumulated depreciation of$2,909.6 millionagainst$4,332.7 millionof gross PP&E ($3,092.8 millionmachinery and equipment;$911.5 millionbuildings) yields a67.15%depreciation maturity ratio, signaling a mature physical asset base.
Scroll horizontally to view all columns.
| Issuer and 2025 10-K Item 2 locator | Disclosed domestic vs global facility count | Physical capacity and 2025 output disclosed | U.S. vs global long-lived tangible assets ($M) | Net PP&E vs Operating Lease ROU Assets ($M & %) | 2025 plant openings, acquisitions and mill closure charges |
|---|---|---|---|---|---|
| Packaging Corp of America (PKG); Item 1 (pp. 3-5) & Item 2 (p. 16) | 10 U.S. mills (9 containerboard mills in TN, LA, MI, AL, OH, VA, WI, GA, WA + UFS paper mill at International Falls, MN) and 91 U.S. corrugated plants (56 corrugators, 35 sheet/other) | 5.8M tons (358 BSF) containerboard capacity; 5,154k tons (304.9 BSF) 2025 board output; 71.1 BSF corrugated shipments; 484k tons UFS paper output; 1,150k tons (22%) purchased recycled fiber |
Primarily U.S. ($4,985.1M Net PP&E; no significant foreign long-lived assets) |
$4,985.1M Net PP&E vs $376.0M ROU assets (7.54% ROU/PP&E); mills owned in fee |
Added 2 U.S. mills (Massillon, OH; Riverville, VA; 800k tons) and 8 corrugated plants via $1,800.5M Greif deal (Sept 2, 2025); shut Wallula, WA No. 2 machine & kraft pulping ($128.0M Q4 2025 charge) |
| International Paper (IP); Item 2 (p. 34), Note 21 (p. 116) & Appendix I (pp. A-1 to A-3) | North American and EMEA containerboard mills, corrugated box plants, kraft bag plants and recycling centers itemized by state/country in Appendix I | Reports segment CapEx ($1,115.0M PS NA; $573.0M PS EMEA) and D&A ($1,724.0M PS NA); divested Global Cellulose Fibers pulp mills ($1,800.0M assets held for sale) |
$7,247.0M U.S. out of $14,460.0M global long-lived assets (50.12% U.S.; $6,998.0M EMEA; $215.0M Americas ex-U.S.) |
$14,443.0M Net PP&E vs $697.0M ROU assets (4.83% ROU/PP&E) |
Acquired DS Smith (EMEA/NA mills & box plants); booked 2025 closure charges at 3 U.S. containerboard mills: Savannah, GA ($125.0M), Riceboro, GA ($96.0M) and Red River, LA ($84.0M) |
| Amcor plc (AMCR); Item 2 (p. 28) & Note 21 (p. 108) | 423 global facilities post-Berry merger: 210 in Global Flexible Packaging Solutions (36 countries) and 213 in Global Rigid Packaging Solutions (34 countries) | Physical tonnage/unit output not disclosed in Form 10-K; segment CapEx is $391.0M Flexibles and $182.0M Rigid ($580.0M total CapEx vs $708.0M D&A) |
$3,872.0M U.S. Net PP&E out of $8,202.0M global Net PP&E (47.21% U.S., up from $1,717.0M in FY24) |
$8,202.0M Net PP&E vs $1,116.0M ROU assets (13.61% ROU/PP&E); Flexibles ~75% owned / ~25% leased; Rigid ~55% owned / ~45% leased |
Closed Berry Global merger on April 30, 2025 ($10,397.0M equity consideration + $5,222.0M debt assumed), adding $4,310.0M of acquired PP&E to year-end balance sheet |
| Ball Corporation (BALL); Item 2 (pp. 19-20) & Note 3 (p. 51) | 63 active global manufacturing plants: 19 in Beverage packaging, N&CA (16 in U.S. across 13 states, 2 in Mexico [Monterrey, Queretaro], 1 in Canada [Whitby]), 21 EMEA, 11 South America, 3 Asia, 9 Personal & Home Care (0 in U.S.) | Top 3 customers represent 40% of consolidated sales (AB InBev 15%, Coca-Cola Bottlers 14%, Red Bull 11%); segment D&A is $225.0M N&CA, $202.0M EMEA, $145.0M SA |
$3,218.0M U.S. out of $8,050.0M global net long-lived assets (39.98% U.S.; $1,149.0M Brazil; $3,683.0M Other) |
$6,656.0M Net PP&E vs $355.0M ROU assets (5.33% ROU/PP&E) |
Deconsolidated Saudi Arabia beverage can JV (Aug 2025) and moved aluminum cups business into 49% unconsolidated partnership following $233.0M Q4 2024 impairment |
| Sealed Air Corp (SEE); Item 2 (p. 26), Note 6 (p. 90) & Note 8 (p. 91) | 105 global manufacturing facilities (50 Food, 68 Protective, with 13 dual-segment sites): 51 in Americas (24 Food, 32 Protective), 26 EMEA (16 Food, 14 Protective), 28 APAC (10 Food, 22 Protective) | Gross PP&E of $4,332.7M ($3,092.8M machinery & equipment, $911.5M buildings) less $2,909.6M accumulated depreciation (67.15% depreciated) |
$982.1M U.S. out of $1,789.2M consolidated long-lived assets (54.89% U.S.; $1,081.7M Americas total) |
$1,423.1M Net PP&E vs $82.4M ROU assets (5.79% ROU/PP&E) |
Ongoing Cost Take-Out to Grow restructuring across Food ($193.1M D&A) and Protective ($91.6M D&A) converting networks |
Rule of thumb: when an issuer’s operating lease ROU assets exceed 12% of Net PP&E or when more than 35% of its converting sites are leased (as in rigid plastic bottle blowing or regional sheet-feeder warehouses), check the lease maturity schedule under ASC 842 before assuming low capital expenditure requirements, and pair plant counts with types of capital expenditure.
Takeaway: Verify domestic plant counts, owned versus leased tenure, and U.S. long-lived tangible assets in Form 10-K Item 2 and the segment footnote before equating two companies with similar reported sales.
ASC 350 goodwill bloat and acquisition timing in packaging returns
Decades of roll-up mergers and private-equity consolidation across U.S. plastic, flexible, paperboard and metal packaging (Amcor + Bemis + Berry Global; International Paper + DS Smith; WestRock + Smurfit Kappa; Sealed Air + Liquibox; PCA + Boise + Greif Containerboard) have loaded packaging balance sheets with ASC 805 / ASC 350 Goodwill and definite-lived customer-relationship intangibles. When a researcher screens the largest plastic packaging companies or top flexible packaging companies in the USA using Total Assets or Book Invested Capital, failing to strip out acquisition goodwill mistakes historical M&A purchase premiums for physical manufacturing capacity.
Define the balance-sheet capital ratios explicitly before comparing asset scale or return on invested capital (ROIC) across packaging peers (building on our manufacturing company valuation framework, EBITDA valuation guide and market cap versus enterprise value):
Book_Invested_Capital = Total_Debt_and_Finance_Leases + Total_Book_Equity - Unrestricted_Cash_and_ST_Marketable_SecuritiesTangible_Invested_Capital = Book_Invested_Capital - Goodwill - Identifiable_Intangible_Assets_NetIntangible_Bloat_Share_Pct = ((Goodwill + Identifiable_Intangible_Assets_Net) / Book_Invested_Capital) * 100Intangibles_to_Net_PPE_Ratio = (Goodwill + Identifiable_Intangible_Assets_Net) / Net_PPEThe 2025 SEC Form 10-K balance-sheet audit below ranks the same five benchmark issuers by the share of their Book Invested Capital consumed by Goodwill and Net Identifiable Intangibles (Intangible_Bloat_Share_Pct).
Scroll horizontally to view all columns.
| Company and 2025 balance-sheet date | Primary packaging business and M&A history | Net PP&E ($M) | ASC 350 Goodwill ($M) | Net identifiable intangibles ($M) | Combined Goodwill + Intangibles ($M) | Total Assets ($M) | Book Invested Capital ($M) | Tangible Invested Capital ($M) | Goodwill + Intangibles % of Book IC | Goodwill + Intangibles ÷ Net PP&E |
|---|---|---|---|---|---|---|---|---|---|---|
| Amcor plc (AMCR); June 30, 2025 (p. 54, Note 4 pp. 66-67) | Flexible & rigid plastics roll-up (closed $10,397M Berry Global merger on April 30, 2025 + $5,222M debt assumed) |
$8,202.0 | $11,276.0 | $7,403.0 | $18,679.0 | $37,066.0 | $25,011.0 ($14,098M debt + $11,740M equity - $827M cash) |
$6,332.0 | 74.68% | 2.28x |
| Sealed Air Corp (SEE); Dec 31, 2025 (p. 67, Note 9 p. 92) | Flexible food barrier bags/shrink film & protective plastics (post-Liquibox & Automated Packaging Systems deals) | $1,423.1 | $2,900.8 ($1,237.1M Food; $1,663.7M Protective) |
$333.3 ($59.5M 2025 amortization) |
$3,234.1 | $7,012.8 | $4,903.2 ($4,009.7M debt + $1,237.5M equity - $344.0M cash) |
$1,669.1 | 65.96% | 2.27x |
| Ball Corporation (BALL); Dec 31, 2025 (p. 38, Notes 11-12 pp. 59-60) | Global aluminum beverage cans (post-Rexam acquisition; $1,277M N&CA, $1,457M EMEA, $1,300M SA, $345M Other goodwill) |
$6,656.0 | $4,379.0 | $982.0 ($148.0M 2025 amortization) |
$5,361.0 | $19,524.0 | $11,221.0 ($7,012.0M debt + $5,421.0M equity - $1,212.0M cash) |
$5,860.0 | 47.78% | 0.81x |
| International Paper (IP); Dec 31, 2025 (p. 64, Notes 11-12) | Integrated corrugated & containerboard (acquired DS Smith in 2025; recorded $2,467.0M PS EMEA goodwill impairment in 2025) |
$14,443.0 | $5,326.0 | $4,043.0 (up from $72.0M in 2024 due to DS Smith) |
$9,369.0 | $37,964.0 | $23,513.0 ($9,831.0M debt + $14,827.0M equity - $1,145.0M cash) |
$14,144.0 | 39.85% | 0.65x |
| Packaging Corp of America (PKG); Dec 31, 2025 (p. 39, Note 3 pp. 51-52) | Domestic integrated containerboard mills & corrugated plants (acquired Greif containerboard on Sept 2, 2025 for $1,800.5M) |
$4,985.1 | $1,372.3 | $602.3 | $1,974.6 | $10,725.5 | $7,971.7 ($3,974.5M debt/leases + $4,598.0M equity - $600.8M cash/ST sec) |
$5,997.1 | 24.77% | 0.40x |
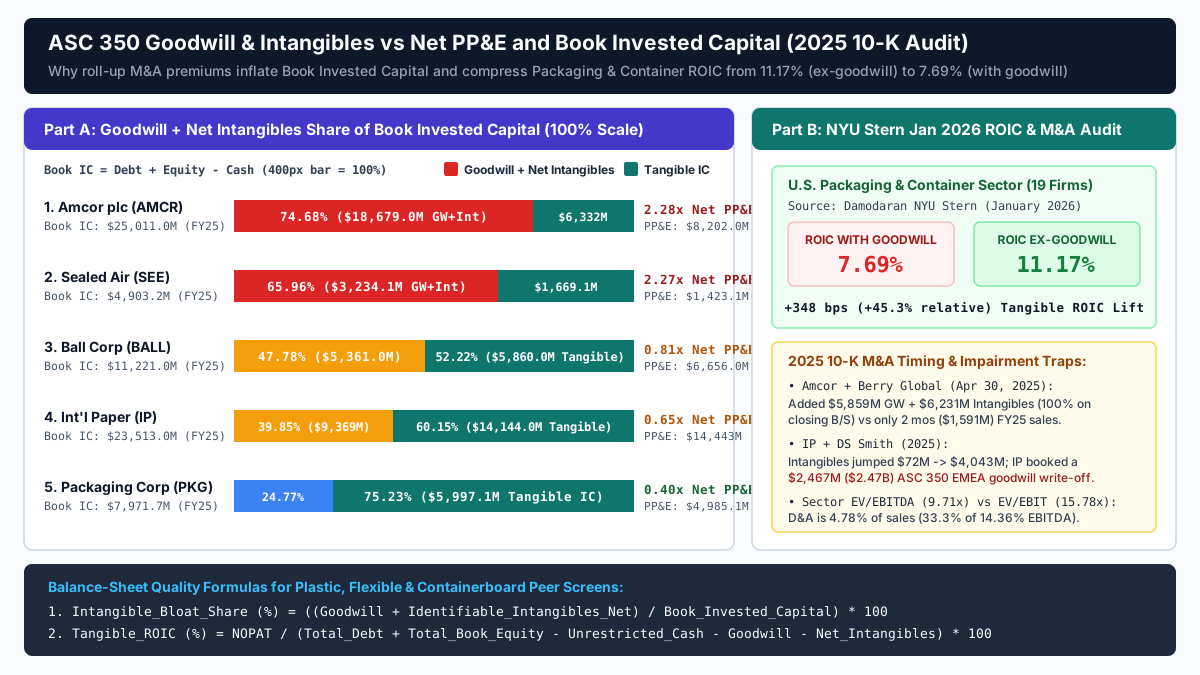
Three accounting findings from this table and Aswath Damodaran’s January 2026 NYU Stern U.S. Packaging & Container sector dataset (19 U.S.-listed firms) govern financial comparisons across packaging companies:
- Plastic and flexible packaging roll-ups carry more than
2.25xas much goodwill and intangibles as physical plant and equipment: At Amcor ($18,679.0 millioncombined goodwill and net intangibles versus$8,202.0 millionNet PP&E, or2.28x) and Sealed Air ($3,234.1 millionversus$1,423.1 millionNet PP&E, or2.27x), acquisition intangibles represent74.68%and65.96%of Book Invested Capital. By contrast, at mill-intensive PCA, even after adding$449.9 millionof goodwill and$460.0 millionof customer-relationship and trademark intangibles from the September 2, 2025 Greif containerboard acquisition ($761.6 millionPP&E added), combined goodwill and intangibles ($1,974.6 million) represent only24.77%of Book Invested Capital and0.40xNet PP&E ($4,985.1 million). - Partial-year M&A consolidation breaks unadjusted asset turnover and return ratios: When Amcor closed the Berry Global merger on April 30, 2025 (two months before Amcor’s June 30, 2025 fiscal year-end; Note 4, pp. 66-67), Amcor’s closing balance sheet absorbed 100% of Berry’s assets, including
$4,310.0 millionof PP&E,$6,231.0 millionof identifiable intangibles ($5,495.0 millioncustomer relationships amortized over 12 years) and$5,859.0 millionof goodwill ($1,657.0 millionFlexibles,$4,202.0 millionRigid), pushing Total Assets to$37,066.0 million. However, Amcor’s FY2025 income statement ($15,009.0 millionnet sales) included only two months of Berry’s post-closing revenue ($1,591.0 million) and a-$137.0 millionpost-closing net loss weighed down by$133.0 millionof inventory step-up amortization and$202.0 millionof transaction and integration costs. Similarly, PCA’s 2025 income statement includes only four months of Greif containerboard operations (from September 2, 2025) against 100% of Greif’s closing assets. Dividing reported fiscal-year sales or NOPAT by year-end invested capital without a pro forma full-year adjustment or time-weighted denominator severely understates capital turnover and ROIC. - Sector-wide goodwill compression and the EV/EBITDA-to-EV/EBIT multiple wedge: In NYU Stern’s January 2026 U.S. sector tables for Packaging & Container (19 firms), cumulated Return on Invested Capital (ROIC) including goodwill is
7.69%, whereas ROIC excluding goodwill jumps to11.17%, a+348 basis point(+45.3%relative) spread driven by historical M&A goodwill on converter balance sheets. In the same January 2026 dataset, the U.S. Packaging & Container sector trades at9.71xpositive-EBITDAEV/EBITDAand15.78xEV/EBIT(19.92xEV/EBIT(1-t)), with a24.27%Gross Margin,14.36%EBITDA Margin,9.58%Pre-tax Operating (EBIT) Margin,89.84%CapEx/Depreciation,5.14%Net CapEx/Sales,1.84xSales/Invested Capital and12.66%Non-cash Working Capital/Sales. Notice whyEV/EBIT(15.78x) is62.5%higher thanEV/EBITDA(9.71x): depreciation and amortization consume4.78%of sales (33.3%of EBITDA), combining physical mill/press depreciation with heavy non-cash amortization of M&A customer intangibles ($246.0 millionat Amcor,$148.0 millionat Ball and$59.5 millionat Sealed Air in 2025). At the single-company level, ASC 350-20 requires annual reporting-unit goodwill impairment testing: in 2025, International Paper recorded a$2,467.0 million($2.47 billion) non-cash goodwill impairment charge on its Packaging Solutions EMEA segment while simultaneously adding DS Smith intangibles (pushing IP’s net intangibles from$72.0 millionin 2024 to$4,043.0 millionin 2025). Compare these multiples using the rules in company valuation multiples.
Takeaway: Calculate both Book ROIC (including goodwill, measuring management’s historical acquisition capital allocation) and Tangible ROIC (excluding goodwill and deal intangibles, measuring underlying plant operating economics), and never divide a partial-year M&A income statement by a 100%-consolidated closing balance sheet.
Ten-point verification checklist for domestic packaging company screens
Before admitting any candidate company into a U.S. Top 100 packaging dataset or comparing plastic, flexible, paperboard or metal container peers, run the ten-point verification checklist below and log the exact filing locators.
Scroll horizontally to view all columns.
| Check # | Verification step | Primary source and filing locator | Pass / adjustment rule for the research ledger |
|---|---|---|---|
| 1 | Isolate external packaging segment sales | Form 10-K Item 8 Segment Note (ASC 280-10-50-22) | Subtract non-packaging segments (such as PCA’s $615.4M UFS Paper and $80.0M logistics or IP’s $197.0M Other) and intersegment transfers ($188.0M at IP; $154.1M at PCA) |
| 2 | Filter U.S. origin revenue from global and regional totals | Form 10-K Entity-Wide Geographic Note (ASC 280-10-50-41) | Record U.S.-domicile external revenue ($14,439.0M IP; $6,163.0M Ball; $2,753.0M SEE); if only North America is disclosed ($7,194.0M Amcor), tag the row as North America (NA) rather than U.S.-only |
| 3 | Check export shipments inside U.S. origin sales | Form 10-K Geographic Note export footnote | Where disclosed (such as IP’s $965.0M U.S. exports inside $14,439.0M U.S. sales), record domestic destination sales ($13,474.0M) alongside U.S. origin sales |
| 4 | Reconcile ASU 2023-07 segment expense boundaries | Form 10-K Segment Note significant expense lines | Do not compare Segment Gross Profit (30.56% Food / 28.55% Protective at SEE) with GAAP Segment Operating Income (13.57% at PCA) or Adjusted EBIT (13.41% Flexibles / 9.06% Rigid at Amcor) without an SG&A and D&A bridge |
| 5 | Assign six-digit 2022 NAICS substrate codes | 2022 Economic Census EC2231BASIC & Form 10-K Item 1 product descriptions | Tag corrugated (322211), folding cartons (322212), flexible bags/pouches (326111), flexible film/laminates (326112), foil/paper laminates (322220), plastic bottles (326160), closures/thermoforming (326199), glass (327213) and metal cans (332431) |
| 6 | Deduplicate vertical rollstock transfers in Census benchmarks | Census ASM / EC2231BASIC VALADD vs RCPTOT |
Use Census Value Added (VALADD) when aggregating upstream paperboard mills (322130) with box plants (322211) or film extruders (326112) with pouch converters (326111) |
| 7 | Audit U.S. plant count, mill tonnage and lease intensity | Form 10-K Item 1 & Item 2 Properties (17 CFR 229.102) and ASC 842 Lease Note | Record domestic plant counts (16 U.S. can plants at Ball; 9 mills and 91 box plants at PCA), physical output (5,154k tons / 71.1 BSF at PCA) and Operating_Lease_ROU_Assets / Net_PPE (13.61% at Amcor vs 4.83% at IP) |
| 8 | Verify U.S. share of long-lived tangible assets | Form 10-K Geographic Note long-lived assets table | Cross-check whether domestic tangible asset share (50.12% IP, 47.21% Amcor, 39.98% Ball, 54.89% SEE, ~100% PCA) matches the domestic revenue share |
| 9 | Strip ASC 350 goodwill and intangibles from invested capital | Form 10-K Balance Sheet & Goodwill/Intangibles Notes (ASC 350-20) | Compute both Book Invested Capital and Tangible Invested Capital (Book_IC - Goodwill - Net_Intangibles), noting intangible bloat shares (74.68% Amcor, 65.96% SEE, 47.78% Ball, 39.85% IP, 24.77% PCA) |
| 10 | Adjust for mid-year M&A, divestitures and impairments | Form 10-K Acquisition Note (ASC 805) & Discontinued Operations Note | Flag partial-year income-statement contributions (2 months of Berry in Amcor FY25; 4 months of Greif in PCA 2025), discontinued operations (IP’s Global Cellulose Fibers) and ASC 350 goodwill write-offs (IP’s $2,467.0M EMEA charge) |
Copy the reusable plain-text audit record below into your research ledger to keep every company row tied to verifiable primary disclosures:
Entity & Ticker/CIK | Filing Period & Form 10-K URL | 6-Digit NAICS Codes |
Consolidated Sales ($M) | Packaging Segment External Sales ($M) |
Disclosed U.S. Origin Sales ($M) or NA Sales ($M) | ASU 2023-07 Profit & Expense Basis |
U.S. Mills & Converting Plants (Item 2) | Physical Output (Tons / BSF / Units) |
U.S. Long-Lived Assets ($M & %) | Net PP&E ($M) & ROU Lease Ratio (%) |
Book Invested Capital ($M) | Goodwill + Net Intangibles ($M & % of Book IC) |
Mid-Year M&A / Divestiture / Impairment Notes | Access Date
Methodological boundaries of public U.S. packaging data
- Closely held private-equity converters do not file public SEC Form 10-K reports: A substantial portion of the middle-market U.S. flexible, thermoformed plastic and corrugated sheet-converting sector is owned by private equity sponsors or private family holding companies. Unless a private converter has registered public senior notes requiring SEC Form 10-K or 20-F filings, third-party revenue estimates in commercial Top 100 directories cannot be audited against ASC 280 segment notes or Item 2 plant tables. Keep private estimates in a separate unverified tier rather than mixing them into audited SEC peer averages.
- North American regional reporting versus strict 50-state U.S. boundaries: When an issuer reports North America as its narrowest geographic revenue line (such as Amcor’s
$7,194.0 millionNorth American revenue across Flexibles and Rigid), public filings do not permit an exact split between the United States, Canada and Mexico on the revenue line, even when U.S.-only Net PP&E ($3,872.0 millionat Amcor) is disclosed in the long-lived asset table. - Association survey paywalls and establishment disclosure suppression: While the 2022 Economic Census (EC2231BASIC) is freely accessible via the Census API, detailed state-by-state or narrow product lines are occasionally suppressed by the Census Bureau (
Dflags) to prevent disclosing individual company operations where a single mill or can plant dominates a state cell. Similarly, full converter benchmark tables in the Flexible Packaging Association annual report are restricted to association members or paid subscribers.
Takeaway: Record every company row with its exact SEC Form 10-K note locator, six-digit NAICS substrate code and domestic revenue boundary, and segregate unverified private-company revenue estimates from audited public disclosures.
Frequently asked questions
Why do trade lists of the top 100 packaging companies in the US disagree on rankings?
Trade-magazine lists disagree because they mix global consolidated revenue, North American regional segment sales and U.S.-only origin sales without a uniform boundary. Across five benchmark 2025 SEC Form 10-K filers (International Paper, Amcor, Ball, Packaging Corporation of America and Sealed Air), headline consolidated revenue totals $66,153.1 million, whereas disclosed U.S. or North American packaging revenue totals $38,842.9 million (58.72%). The remaining $27,310.2 million (41.28%) consists of foreign packaging operations ($26,417.8 million) and non-packaging communication paper or logistics segments ($892.4 million). On a global consolidated basis, Ball ($13,161.0 million) ranks ahead of PCA ($8,989.3 million), whereas on a verified domestic packaging basis, PCA ($8,293.9 million) ranks $2,130.9 million (+34.6%) ahead of Ball’s U.S. origin revenue ($6,163.0 million).
How do you screen the largest plastic packaging companies and top flexible packaging companies in the US?
Combine company segment disclosures in SEC Form 10-K filings with the U.S. Census Bureau’s six-digit 2022 NAICS manufacturing codes (EC2231BASIC). For flexible packaging (a $42.9 billion U.S. sector per the Flexible Packaging Association, with polymer usage split 53% PE, 29% PP and 6% PET), screen NAICS 326111 (Plastics Bag and Pouch Manufacturing), 326112 (Plastics Packaging Film and Sheet [including Laminated] Manufacturing) and 322220 (Paper Bag and Coated and Treated Paper Manufacturing, which covers foil-paper laminates). For rigid plastics, combine NAICS 326160 (Plastics Bottle Manufacturing) with packaging closure and thermoforming operations inside 326199 (All Other Plastics Product Manufacturing), and check Census Value Added (VALADD) against Value of Shipments (RCPTOT) to avoid double-counting resin film sold between extruders and pouch converters.
How does mid-year merger accounting distort packaging revenue rankings and invested capital returns?
Under U.S. GAAP (ASC 805 and ASC 350), an acquirer consolidates 100% of a target’s assets, debt, goodwill and identifiable intangibles onto its closing balance sheet on the acquisition closing date, while its income statement includes the target’s revenue and earnings only from the closing date forward. For example, Amcor closed its merger with Berry Global on April 30, 2025 (Note 4, pp. 66-67), adding $4,310.0 million of PP&E, $6,231.0 million of identifiable intangibles and $5,859.0 million of goodwill to its June 30, 2025 balance sheet ($18,679.0 million total goodwill and intangibles, or 74.68% of Amcor’s $25,011.0 million Book Invested Capital), while including only two months ($1,591.0 million) of Berry revenue in FY2025 sales. Across the 19-firm U.S. Packaging & Container sector in NYU Stern’s January 2026 dataset, M&A goodwill compresses sector ROIC from 11.17% (excluding goodwill) to 7.69% (including goodwill).
How can analysts verify a packaging company’s domestic plant count and mill capacity in Form 10-K?
Check Item 1 (Business), Item 2 (Properties, governed by 17 CFR 229.102), the ASC 842 leases footnote and the ASC 280-10-50-41 geographic long-lived assets table in Form 10-K. Item 2 separates integrated domestic mill owners such as PCA (9 U.S. containerboard mills with 5.8 million tons annual capacity producing 5,154 thousand tons in 2025, plus 91 corrugated plants shipping 71.1 BSF, with a 7.54% operating-lease ROU-to-PP&E ratio) and Ball (16 U.S. aluminum beverage can plants out of 19 in North and Central America and 63 globally) from converter networks such as Amcor (423 global facilities, where 45% of rigid blow-molding facilities are leased near filling lines and ROU assets equal 13.61% of Net PP&E).
Continue the research
Related Research
Packaging industry companies: how to compare their businesses
How can readers identify packaging businesses and compare their scale without mixing different revenue, material or geographic boundaries?
Largest packaging companies: segment margins and capital returns
How can researchers compare packaging segment profitability without ranking unlike businesses or inventing segment invested capital?
Paper and packaging board: grades, capacity and pricing spreads
How do paperboard grades, capacity denominators and cash-cost boundaries change a per-tonne pricing-spread analysis?
Sources & Data Notes
-
Filed February 27, 2026. Continuing consolidated net sales of $23,634M, PS North America external sales of $14,987M, PS EMEA external sales of $8,450M, U.S. geographic net sales of $14,439M, U.S. long-lived assets of $7,247M, and $2,467M PS EMEA goodwill impairment.
-
Consolidated FY25 net sales of $15,009M ($10,872M Flexibles, $4,137M Rigid), North America net sales of $7,194M, U.S. net PP&E of $3,872M, 423 facilities post-Berry merger, and $18,679M combined goodwill and net intangibles.
-
Filed February 19, 2026. Consolidated net sales of $13,161M, North and Central America beverage packaging sales of $6,286M, U.S. origin net sales of $6,163M, 16 U.S. beverage can plants, and $5,361M combined goodwill and net intangibles.
-
Filed February 26, 2026. Consolidated net sales of $8,989.3M, Packaging external trade sales of $8,293.9M, Paper segment sales of $615.4M, 9 containerboard mills (5.8M tons capacity) and 91 corrugated plants.
-
Filed March 2, 2026. Consolidated net sales of $5,359.8M ($3,594.7M Food, $1,765.1M Protective), U.S. net sales of $2,753.0M, 105 global plants (51 Americas), and $3,234.1M combined goodwill and net intangibles.
-
Defines establishment-level census variables for 6-digit packaging NAICS codes 322211, 322212, 322219, 322220, 326111, 326112, 326160, 327213, 332431 and 333993.
-
Documents why 4-digit groups 3222 and 3261 include non-packaging products and how flexible laminations split across 326111, 326112 and 322220.
-
Explains why summing Value of Shipments (RCPTOT) across vertically linked NAICS codes double-counts intermediate rollstock and why Value Added (VALADD) removes inter-plant duplication.
-
Distinguishes single-location physical establishments assigned one primary NAICS code from multi-establishment parent enterprises.
-
Establishes U.S. GAAP rules for reportable segments, significant segment expense lines and domestic versus foreign revenue and long-lived asset tables.
-
Governs goodwill allocation to reporting units, quantitative impairment testing and segment goodwill rollforwards.
-
Sets the SEC legal requirement for Form 10-K Item 2 property disclosures.
-
Defines U.S. flexible packaging across plastic films, paper, aluminum foil and multi-layer barrier laminations.
-
Reports U.S. Packaging & Container sector EV/EBITDA (9.71x), EV/EBIT (15.78x), EBITDA margin (14.36%), EBIT margin (9.58%), Sales/IC (1.84x), and ROIC with goodwill (7.69%) versus excluding goodwill (11.17%).