
Packaging industry challenges: how to test a slowdown claim

Key Takeaways
- Separate the affected product, region and production stage before evaluating a slowdown claim.
- Real output, nominal shipments, producer prices and inventories measure different things.
- EU packaging requirements have phased dates and conditions; the general application date does not settle every requirement.
- Equipment investment depends on the customer's project purpose and evidence beyond an industry index.
Research Scope
- Regions
- United States statistics; selected rules for packaging placed on the EU market
- Period
- July and August 2026 output observations; historical 2018 to 2021 ASM definitions; EU clauses checked October 2026
- Industries
- Packaging materials, converters and machinery; broad paper and plastics output proxies
- Data objects
- Real-output indexes, nominal shipments, inventory stocks, capital expenditure fields and regulatory dates
Treating a packaging cost problem as proof of falling demand can send research toward the wrong investment conclusion. Test packaging industry challenges by separating real output, prices, inventories and regulatory changes, then checking the affected product, region and period.
An operating challenge can raise costs or change a package while output stays stable. A packaging industry slowdown is a narrower claim: activity has weakened for a defined segment over a stated period. The tables below help decide which evidence would support that claim and what remains untested.
Quick reference. Inputs to a packaging slowdown investigation.
Scroll horizontally to view all columns.
| Input or item | Typical value or source | Why it matters |
|---|---|---|
| Industry boundary | Census NAICS definitions and product scope | Separates converters, materials and machinery |
| Real output | Federal Reserve G.17, distributed through FRED | Tracks production separately from selling prices |
| Selling prices | BLS Producer Price Index definitions | Helps interpret a monetary shipment movement |
| Shipments and inventories | Census ASM fields and M3 methodology | Separates a period’s flow from a stock at a date |
| EU rule timing | PPWR articles and transition clauses | Identifies which requirement and date to investigate |
| Investment purpose | Customer project disclosures and capital spending | Distinguishes expansion, replacement and adaptation |
Separate an operating challenge from a demand slowdown
Start with the production stage and the measurable claim. Material suppliers, packaging converters, machinery makers and the businesses packing goods face different conditions. The packaging industry research guide places these stages in the same chain without treating them as one statistical industry.
For example, the Census 2022 NAICS Manual distinguishes corrugated and solid fiber boxes (322211), folding paperboard boxes (322212), plastics bags and pouches (326111), and plastics packaging film and sheet (326112). Packaging machinery manufacturing has its own code, 333993. A statement about a converter’s production and one about equipment orders need different observations.
Use the matrix as a set of hypotheses to investigate. It does not rank the prevalence or severity of current packaging industry problems.
Table 1. Challenge hypotheses, evidence needed and alternative explanations. SRP Blog synthesis of the statistical definitions and selected rules cited below.
Scroll horizontally to view all columns.
| Challenge hypothesis | What to check | Alternative explanation to retain | Possible investment question |
|---|---|---|---|
| Customers pack fewer goods | Matched customer output or sales volumes and packaging production | A mix change, imports or a production interruption | Has the need for additional capacity changed? |
| Customers draw down packaging stocks | Comparable monthly inventory and shipment records plus customer evidence | Price movements or a mismatch in reporting units | Are replenishment orders temporarily below consumption? |
| Input or selling-price pressure changes economics | Product-matched prices, expenses and contract terms | Different input and output products or pricing periods | Is the project intended to reduce recurring expenses? |
| Material or format requirements change | Applicable rule, package specification and actual adaptation plan | Existing equipment may accommodate the change | Is spending for adaptation rather than expansion? |
| A supply or operating constraint limits output | Documented downtime, delivery constraints or process evidence | Weak customer demand may produce similar output data | Is replacement or efficiency spending needed? |
The sector value-chain guides help locate the end industry when a claim concerns food, beverages or another product being packed. Define that customer boundary before using its activity as evidence for a packaging segment.
Takeaway: Turn a broad challenge statement into a specific hypothesis about a product, stage and measurement.
Check real output with the exact series
Industrial production provides a real-output measure. Two verified US series offer broad paper and plastics proxies; their coverage extends beyond packaging.
Table 2. Federal Reserve series distributed through FRED. United States, monthly, seasonally adjusted, index 2017=100. Observations shown in the September 18, 2026 update, checked October 10, 2026.
Scroll horizontally to view all columns.
| Series ID | Official industry title within manufacturing nondurable goods | July 2026 | August 2026 | Packaging research boundary |
|---|---|---|---|---|
| IPG322S | Paper (NAICS = 322) | 79.2875 | 79.0932 | Broad paper industry; includes nonpackaging output |
| IPG3261S | Plastics Product (NAICS = 3261) | 97.1385 | 96.5814 | Broad plastics products; includes nonpackaging output |
The Paper series record and Plastics Product series record supply the identifiers, readings and units. Calculate a change within the same series as (later level / earlier level - 1) × 100. For July to August 2026, that gives approximately -0.25% for paper and -0.57% for plastics products. These are calculations from the displayed observations, not agency conclusions about packaging demand.
The two index levels also cannot show the relative size of paper and plastics markets. Each expresses output relative to its own base-year level. The Federal Reserve’s G.17 definition treats capacity utilization separately, relating the seasonally adjusted output index to the associated capacity index.
Common mistake: Reading an index level below 100 as a capacity-utilization percentage. Record the metric and units before interpreting the number.
Both FRED records list October 16, 2026 as the next release date. The access date is later than the observation month. Keep those dates separate, and preserve the vintage before comparing a later update. The public data sources directory provides the wider context for matching a source to a research question.
Takeaway: The observed monthly decreases justify a narrower evidence check; they do not establish a whole-industry contraction or its cause.
Keep shipments, inventories and orders in separate columns
Shipment values, inventory stocks and new orders describe different objects. A destocking explanation needs comparable current observations and evidence about customer stocks.
The Census historical ASM table AM1831BASIC01 covers 2018 to 2021 on a NAICS2017 basis. It provides useful field definitions for a research record. The table below identifies the dataset and variables; it supplies no current industry totals.
Table 3. Historical Census ASM field map. Monetary fields are in thousands of US dollars ($1,000); the error field is in percent.
Scroll horizontally to view all columns.
| Field | What Census records | Research use |
|---|---|---|
| RCPTOT | Sales, value of shipments, or revenue ($1,000) | Identify a monetary flow, rather than package count |
| RCPTOT_S | Relative standard error of that estimate (%) | Preserve reported sampling uncertainty |
| INVTOTE | Total inventories, end of year ($1,000) | Identify the stock date and total-inventory scope |
| INVFINE | Finished goods inventories, end of year ($1,000) | Keep finished goods separate from total stocks |
| CEXTOT | Total capital expenditures, new and used ($1,000) | Identify the industry’s own investment boundary |
| CEXMCH | Capital expenditures for machinery and equipment ($1,000) | Distinguish equipment spending from shipment revenue |
Census’s April 2025 benchmark page links a different table, AM2231GS1, for 2018 to 2021. Preserve the exact table and version rather than combining legacy and benchmarked observations. When moving from this historical table to another year, check the classification version even where the industry code looks unchanged.
Nominal shipments can change through prices, quantities or product mix. BLS defines PPI as a measure of producer selling-price movements. The packaging cost-index reading method explains how to match a price series to the product under investigation before interpreting a monetary change.
Inventories are stocks at a date; shipments are flows over a period. For a destocking hypothesis, obtain matched monthly observations, identify whose inventories they measure, and investigate whether customers are consuming stock while reducing replenishment. Falling converter output alone cannot locate the inventory adjustment at the customer.
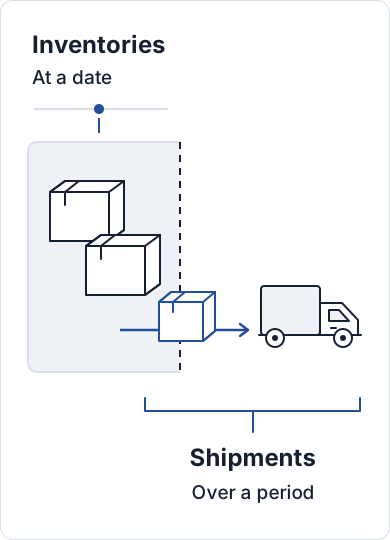
Census M3 methodology distinguishes shipments, inventories and orders, and describes benchmarking and seasonal adjustment. Its new-order estimates include cancellations and modifications. This page uses those definitions, without presenting a current packaging-specific M3 series or an inventory-to-shipments ratio.
Census also warns that adding shipment values across industries can duplicate intermediate transactions. An industry’s shipments cover the establishments classified there, including their secondary products. Keep the original definition, suppression flags and uncertainty when extracting a record.
Takeaway: Use matched data to test destocking, and keep monetary flows, inventory stocks and orders separately identified.
Read EU requirements by article and date
For packaging placed on the EU market, general application and individual requirement dates differ. Regulation (EU) 2025/40, the Packaging and Packaging Waste Regulation (PPWR), applies from August 12, 2026 under Article 71.
Table 4. Selected PPWR timing clauses. Check the applicable category, exemptions and secondary acts before assessing a package.
Scroll horizontally to view all columns.
| Clause | Timing stated in the regulation | Research check |
|---|---|---|
| Article 71 | General application from August 12, 2026 | Separate application from entry into force |
| Article 6(2)(a) | January 1, 2030 or 24 months after relevant delegated acts enter into force, whichever is later | Check design-for-recycling criteria |
| Article 7(1), with 7(4) exemptions | Minimum recycled content in plastic parts of packaging: January 1, 2030 or three years after the relevant implementing act enters into force, whichever is later | Check type, format and plant/year averaging |
| Article 10(1) | Packaging minimisation by January 1, 2030, preserving functionality | Check the proposed package change |
| Article 70(1)(b) | Specified Directive 94/62/EC Article 9 requirements continue until December 31, 2029 | Check Annex II point 1, first indent |
These selected dates come from the original PPWR text. They identify questions to investigate, without establishing a machine-replacement requirement.
Takeaway: Attach the exact clause, category and timing condition to a regulatory investment hypothesis.
Trace the challenge to a particular investment purpose
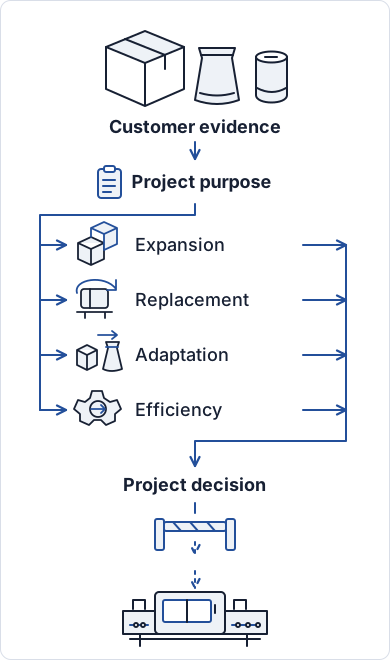
The effect on machinery spending depends on what the customer proposes to do. An expansion project, a replacement and a package adaptation can respond differently to the same operating conditions.
First separate recurring packaging purchases from equipment investment. The CapEx and OpEx explanation gives that accounting boundary. Then follow the customer’s production and project evidence through the capital spending research guide.
Possible links to investigate include:
- Expansion: weaker expected customer output could change the case for added capacity. Check the demand assumptions and project decision.
- Replacement: documented reliability problems could support replacement spending even when total output is stable. Check the equipment condition and approved work.
- Adaptation: a verified material or format change could require a modification, a different machine or no capital work. Check the specification and available equipment.
- Efficiency: an operating-cost constraint could prompt an improvement project. Check the recurring expense, project scope and expected effect before assuming an investment response.
These are conditional research paths, rather than findings that any customer has approved a project. The types of capital expenditure guide helps record the purpose without treating every equipment purchase as capacity growth.
Common mistake: Treating machinery-and-equipment capital expenditures for NAICS 333993 as its customers’ purchases. That field measures investment by establishments classified in packaging machinery manufacturing; customer equipment spending requires customer evidence.
For company work, use the packaging-company boundary and disclosure checks before comparing reported activity. A company segment may mix products, countries and services that the national series measures differently. Record a company’s explanation as its disclosed view, then examine the underlying quantities and project purpose.
Takeaway: Require evidence of the customer’s project purpose before converting a challenge into an equipment-demand conclusion.
When this does not apply: limitations and uncertainty
This method is useful for organizing an industry investigation. It cannot settle a plant decision, an individual package’s compliance or a stock recommendation.
Keep these limits in the research record:
- Paper and plastics-products output indexes include nonpackaging activity and do not cover the entire packaging industry.
- US domestic production does not by itself establish consumption, imports, exports or another region’s demand.
- Historical ASM fields describe an older dataset; their definitions and records cannot establish current activity.
- The input evidence contains no verified current packaging-specific M3 observations, customer destocking record or causal attribution for the monthly decreases.
- Selected EU clauses leave category-specific rules, exceptions and secondary-act status to a separate legal review.
- An industry observation supplies neither a company profit model nor a project return calculation.
The valuation research section explains the separate company and valuation questions. Additional evidence is needed before an industry observation can inform those questions.
Takeaway: State the missing evidence with the proposed conclusion, and keep plant, legal and company decisions within their own scope.
Keep a record that another researcher can repeat
Save the observation separately from the explanation. The record should let another reader reproduce the data check and identify what would weaken the proposed explanation.
Table 5. Reusable packaging challenge research record. Copy the fields for each claim; unknown inputs remain unknown.
Scroll horizontally to view all columns.
| Field | What to record |
|---|---|
| Claim and boundary | Affected product, production stage, region and customer group |
| Measurement | Real output, selling price, nominal shipment, inventory stock or capital expenditure |
| Source identifier | Series ID or table, variable and classification version |
| Time and units | Observation period, frequency, stock date where relevant, units and seasonal adjustment |
| Data vintage | Release/update date, access date and saved source version |
| Observation | Quoted reading or reproducible within-series calculation |
| Explanation to test | Demand change, inventory adjustment, supply constraint, price/mix change or regulatory adaptation |
| Disconfirming evidence | A result that would weaken that explanation, such as stable matched customer volume |
| Investment follow-up | Project purpose, decision evidence and the next missing input |
For the observations in Table 2, an appropriate record says that the broad US paper and plastics-products indexes declined from July to August 2026 in the saved update. It leaves customer demand, destocking and machinery spending unresolved. A follow-up should seek narrower product and customer evidence, rather than relabeling the calculation as a packaging market forecast.
Takeaway: Preserve enough metadata to repeat the check and enough uncertainty to test the explanation.
Frequently asked questions
What is the future of the packaging industry?
These indicators do not establish a forecast. They support questions about defined products and periods. Recheck the next statistical release and customer project evidence before changing an explanation; the FRED snapshots checked here list October 16, 2026 as the next release.
What are the packaging industry’s problems today?
This page tests problem claims rather than ranking them. In the September 18, 2026 update, the broad US paper and plastics-products output indexes both declined from July to August 2026, but neither series identifies a cause. When a later release changes the picture, compare the same observation period in both releases first: a revised reading for the same month and a reading for a new month answer different questions. Save the old value, revised value and source version with the claim.
What are the solutions to packaging industry problems?
No single solution fits every packaging problem; the response depends on the verified constraint. Automation or another productivity project needs evidence about the process and recurring expense. A change in customer consumption or a legal requirement calls for a different investigation, and may call for no equipment project at all.
What were the packaging industry’s problems in 2021?
This page does not reconstruct 2021 events. It uses historical Census ASM fields for 2018 to 2021 to define what a 2021 report measured. To reproduce a 2021 report, use the version it cites. For a separate benchmarked comparison, Census’s April 2025 page links AM2231GS1 for 2018 to 2021. Keep a crosswalk of table, year, industry definition, geography and variable, and keep reproduction and reassessment as separate calculations; this page has not downloaded the benchmarked amounts.
Is the plastic packaging industry slowing down?
The checked data cannot confirm that by themselves. IPG3261S fell about 0.57% from July to August 2026, but it covers all plastics products, including nonpackaging output. Narrower evidence for plastics bags and pouches (NAICS 326111) or packaging film and sheet (326112) is needed. If such a shipment value is suppressed, record it as unavailable rather than zero, and label any broader substitute total as broader.
Was there a packaging industry slowdown in 2022?
This page does not test 2022, so it neither confirms nor rules out a slowdown that year. Its output observations cover July and August 2026, and its ASM fields end in 2021. When reviewing a 2022 account, record order cancellations separately from postponed projects and order modifications, with the reported event, date and reporting entity. M3 new-order estimates include cancellations and modifications, so an aggregate change cannot identify a particular project event.
Takeaway: Resolve conflicting versions, missing values and order events explicitly before using them in a research conclusion.
Method and sources
The output-series register uses Federal Reserve observations distributed through FRED. FRED is a distribution source for those readings, rather than an independent confirmation. Percentage changes are calculated from the displayed levels; rounding does not change their scope.
Census originals supply the classification and field definitions. The ASM discussion identifies a historical table and a later benchmark release; it publishes no historical dollar amount as current demand. M3 is used for methodology only. BLS supplies the producer-price definition, while the detailed price-index tutorial remains in the related cost article.
The legal timing map paraphrases selected original clauses, including the limited continuation of the old Directive requirement. It is not an audit of all secondary legislation. The challenge matrix, investment paths and record template are SRP Blog synthesis for testing hypotheses, with no company case or tested project outcome claimed. The editorial research policy explains the treatment of evidence and assumptions.
Takeaway: Preserve the primary-source definitions and distinguish the observed facts from the research hypotheses built around them.
Continue the research
Related Research
Packaging costs: how to read price indexes
How can researchers track packaging cost pressures without confusing producer selling prices with a manufacturer's total costs?
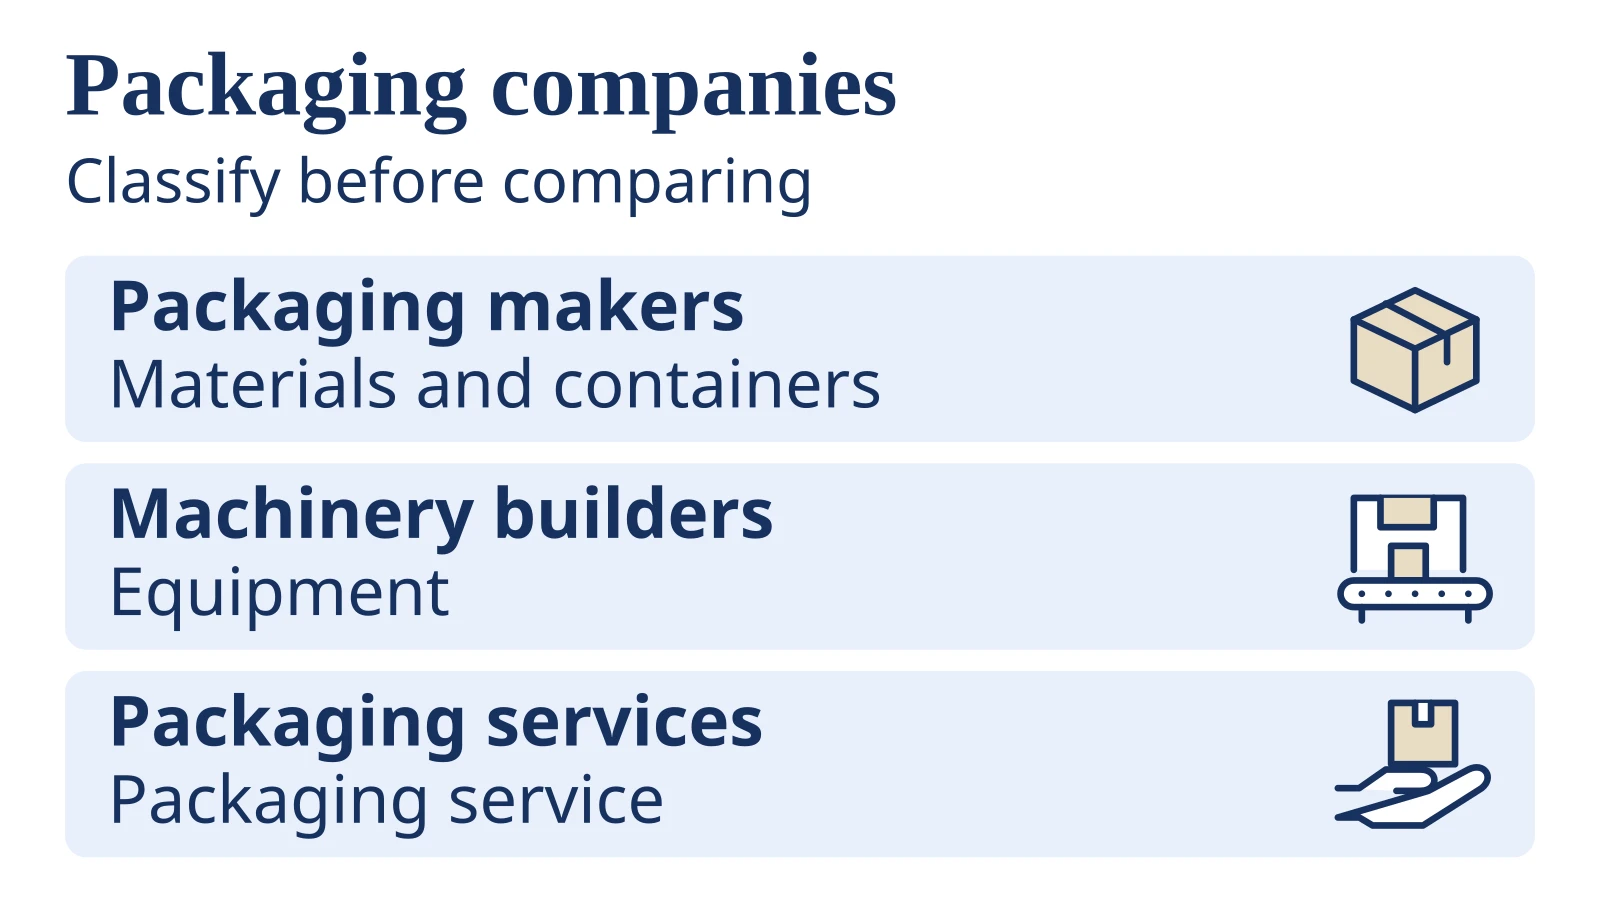
Packaging industry companies: how to compare their businesses
How can readers identify packaging businesses and compare their scale without mixing different revenue, material or geographic boundaries?
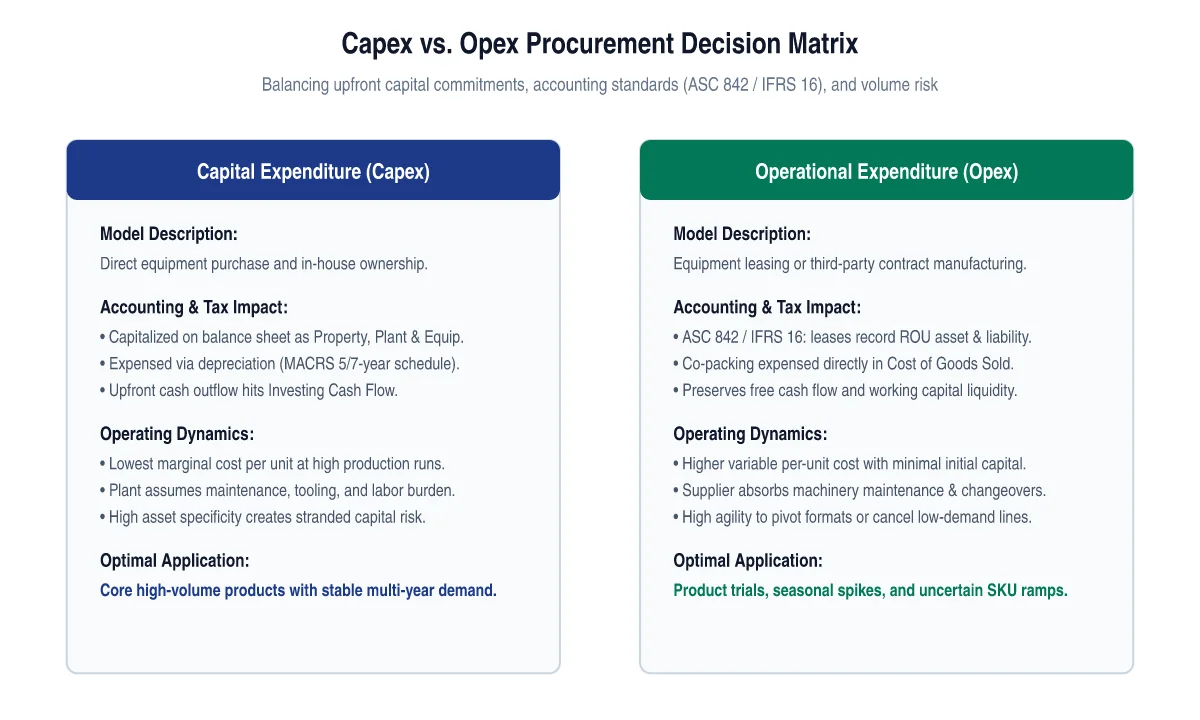
Capex vs Opex in Industrial Manufacturing and Machinery
How do industrial companies evaluate the trade-off between capital expenditure and operational expenditure when acquiring packaging and production capacity?
Sources & Data Notes
-
Broad US paper-industry output proxy, including nonpackaging output.
-
Broad US plastics-products proxy, including nonpackaging output.
-
Historical dataset identification only; no current shipment or inventory amount reported.
-
Version warning only; benchmarked amounts are not reproduced.
-
Method definitions only; no current packaging-specific M3 observations used.
-
Selected original clauses support the timing table; no individual-package compliance assessment.