
Resources & Industrial Sectors
Resource and industrial sectors are built from a few relationships: who owns the assets, who supplies the equipment and services, how projects move from exploration to production, and which end markets pull demand through the chain.
Topics include mining, oil sands and other energy resources, commodity price cycles, capital equipment, and the manufacturing and packaging sectors that consume industrial machinery. Each article defines its terms, states the region and period of its evidence, and separates reported facts from interpretation.
The aim is a clear map of a sector before readers turn to company disclosures or valuation methods. Start with a value-chain guide, then read the demand-side articles on what drives investment in each part of the chain.
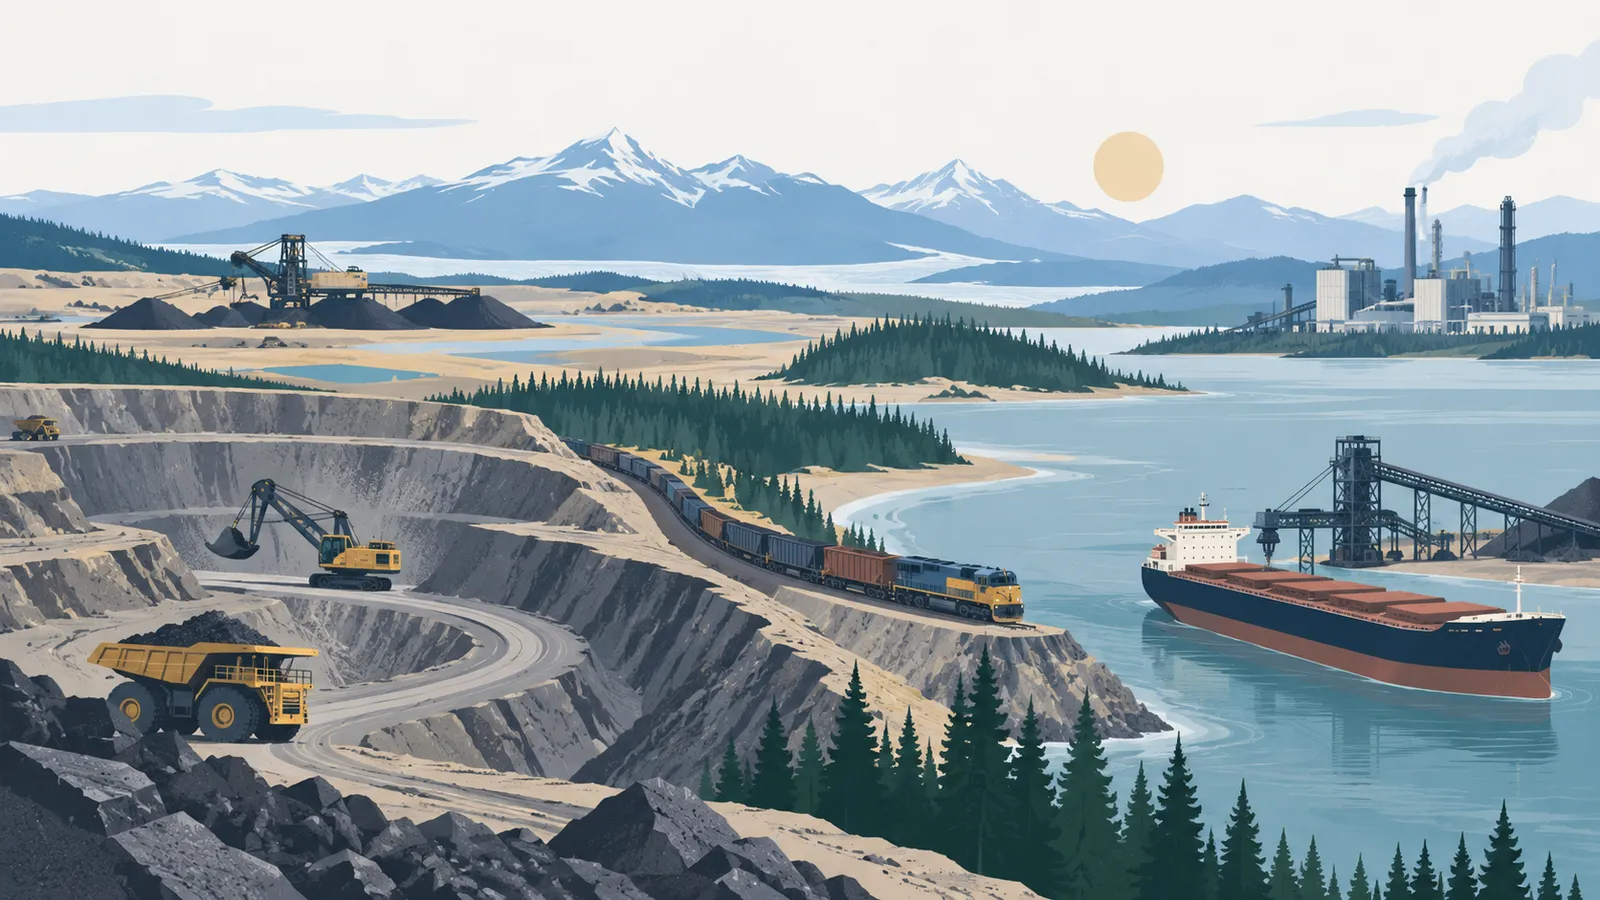
What this section covers
- How the mining value chain runs from exploration to production, and where asset owners, service providers and equipment suppliers fit.
- How junior and exploration companies fund projects and what each project stage means for risk.
- What drives oil sands costs, capital intensity and operating results.
- How commodity price cycles relate to supply response and capital spending.
- How capital equipment businesses earn revenue from machines, parts, service and projects.
- How packaging and food and beverage manufacturing demand shapes investment in equipment.
Not covered
- Stock tips, buy or sell calls and price targets.
- Real-time or daily commodity and share prices.
- Machine price quotes, supplier rankings and product catalogs.
- News coverage of daily market moves.
A Research Guide to Resource and Industrial Sectors
Sector research goes wrong most often at the start, when the sector is treated as a single price chart and not as a chain of businesses with different economics. The working order below puts structure first, then data, and keeps a written record of where the evidence runs out.
Map the chain before you read prices
Before reading any market data, write down who owns the assets, who supplies equipment and services, and who buys the output. In mining, an exploration company, a producer and an equipment supplier face very different risks even though all three are exposed to the same commodity. A stage map such as the one in the mining value chain framework makes those differences explicit and tells you which disclosures to expect from each participant.
Industrial sectors need the same treatment. A business that sells machines behaves differently from one that sells parts, service or projects, and the capital equipment industry guide shows how to separate those revenue models before comparing companies.
A working order for any sector
- Define the sector boundary in one sentence, including what is excluded.
- Map the value chain and mark where capital and risk concentrate.
- Identify the end markets that pull demand through the chain.
- Choose one primary dataset per question and note its definitions, region and period.
- Place the sector in its cycle using several indicators, not one.
- Write down what evidence would contradict your reading.
Each step leaves a short written note. If a step cannot be completed from public sources, record the gap and leave the assumption out.
Four questions every sector raises
What is produced or sold, and by whom? What does it cost to produce, and how capital intensive is the activity? What demand sustains it? Where is the sector in its cycle? The first two are structural and change slowly. The last two are cyclical and need dated evidence.
Energy resources follow the same pattern with different cost drivers. Oil sands economics is a good example of a sector where capital intensity and operating costs must be understood before any price view means anything.
Where the numbers come from
Begin with statistical agencies and regulators and leave commentary for later. For production, reserves and trade in mineral commodities, the USGS Mineral Commodity Summaries is a standard starting point. For commodity price series, the World Bank commodity markets data provides historical benchmarks. For oil and other energy outlooks, the EIA Short-Term Energy Outlook states its forecasts and assumptions openly.
Record the publisher, table, unit and date for every figure at the time you collect it. Reconstructing them later costs far more.
Where sector research goes wrong
Two sources can both report “demand” while using different product scopes, regions or units. Compare like with like, or explain the difference in writing.
Agency outlooks and association projections are conditional on assumptions, so label each figure as reported, estimated or projected and keep the label with the number. A strong or weak year says little about the underlying level, so look at several years and at the indicators that lead and lag the series.
Supply responds to price. High prices attract investment, which later increases supply, and commodity price cycles lays out a framework for that feedback. Finally, sector evidence describes conditions and not any one firm’s results. Move to company disclosures only after the sector map is clear.
Reading order across the section
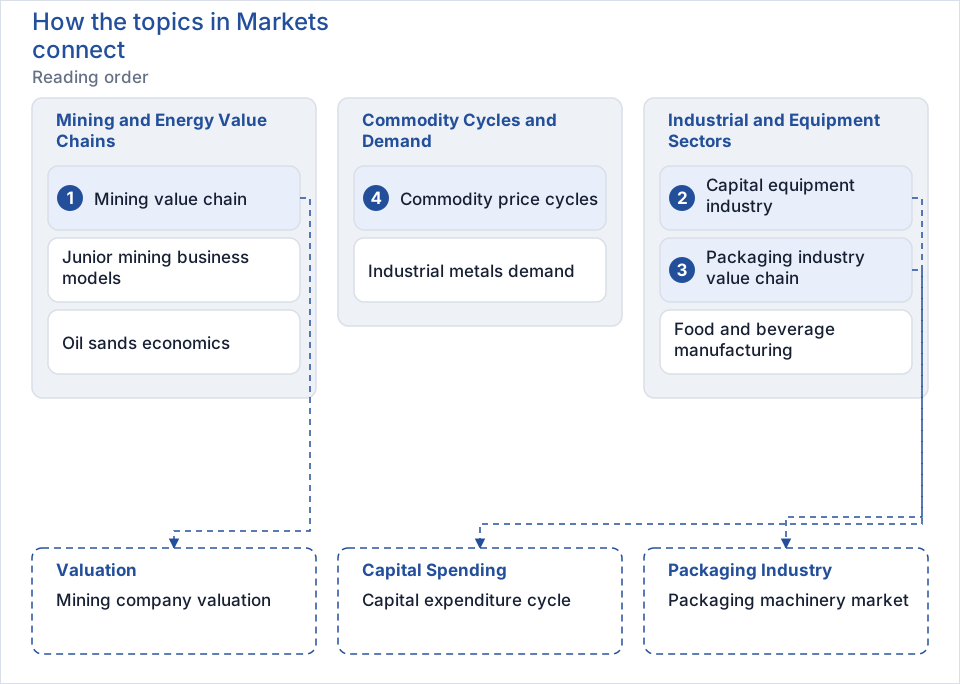
The section has three groups. The mining and energy group describes how resource assets are built and operated. The commodity cycle group explains how prices, supply response and end-market demand interact over time. The industrial group follows the output downstream into the equipment and packaging sectors that consume machinery. A sensible reading order starts with the value chain, then the capital equipment overview, then the packaging chain, and finally the cycle framework, which ties the others together. From there, the valuation section shows how the same structures appear in company disclosures, and the capital spending section explains how cycle conditions turn into investment decisions.
Checking your own work
Before relying on a sector conclusion, reread it and ask whether each claim traces to a dated, named source. Ask whether a different reasonable reading of the same data exists, and whether you have confused a structural fact with a cyclical one. Every article on this site states its scope, sources and limitations, and the editorial policy describes how evidence is selected and labeled. Sector research maps conditions and uncertainties. It makes no forecast and gives no recommendation.