
Industrial Capital Spending
Companies decide to spend on plants, machinery and automation, and that spending then reaches equipment suppliers. Capital expenditure is the link between end-market demand and equipment markets.
Topics include the capex cycle, the split between maintenance and growth spending, capacity utilization, replacement cycles, financing conditions, automation, and the food and packaging sectors where equipment demand is easy to trace to production needs.
The articles are frameworks and indicator lists that name the variables to track and the data sources that report them. Each states the region, period and definition behind every data series, and none predicts turning points in the cycle.
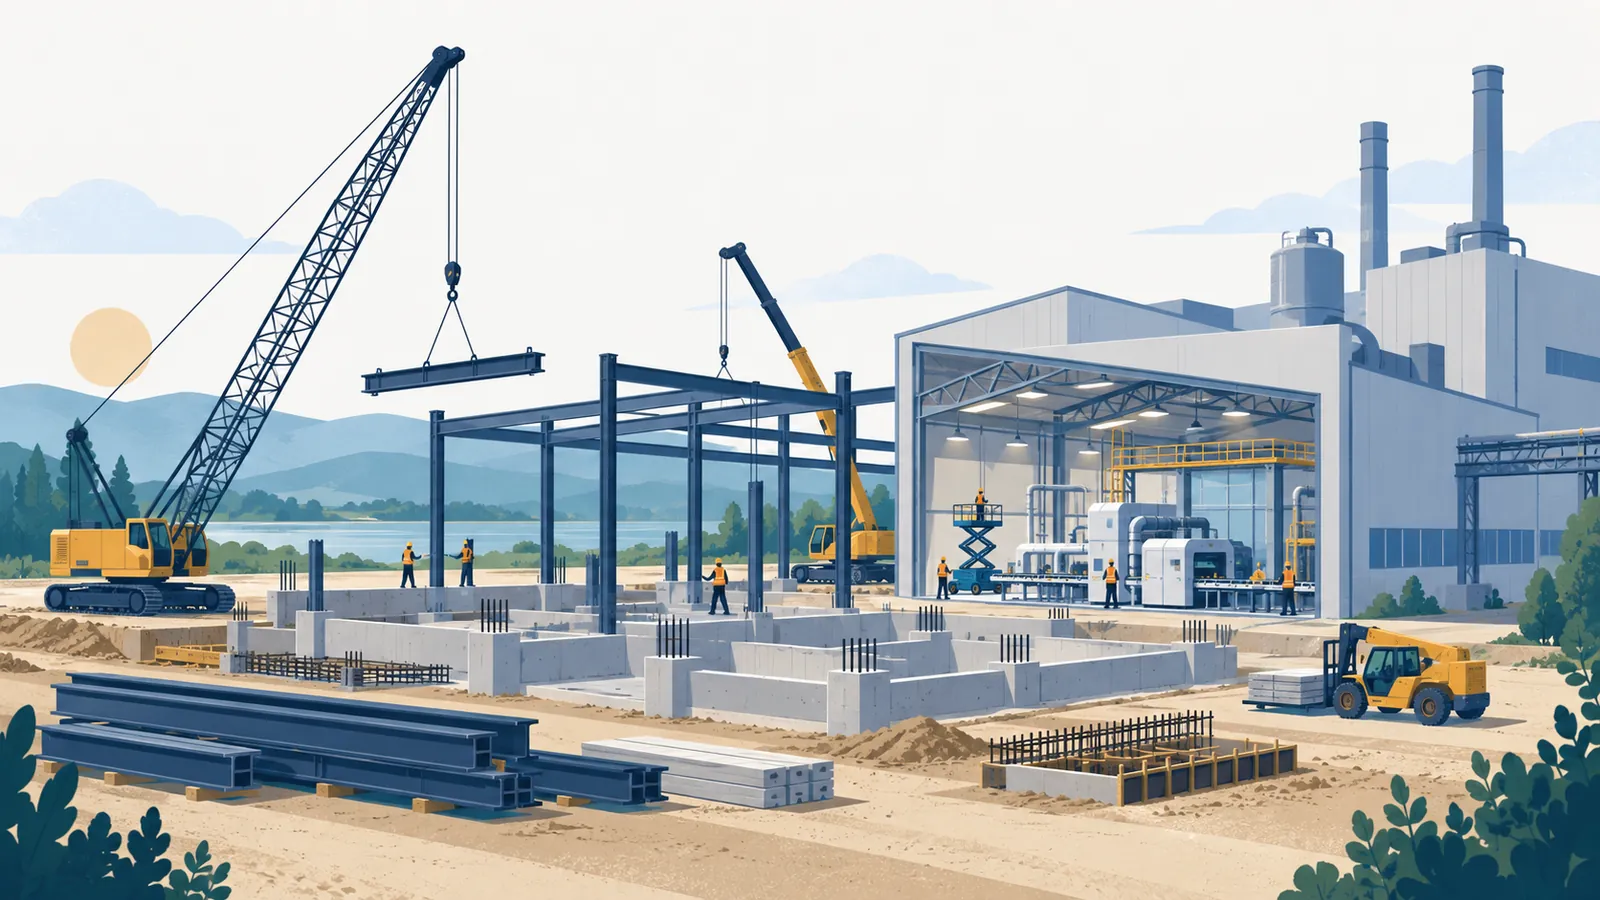
What this section covers
- How a capital expenditure cycle is structured and which variables to follow.
- How maintenance, sustaining, replacement and growth capex differ in definition and disclosure.
- How capacity utilization relates to investment, and where the relationship breaks down.
- Why equipment is replaced for reasons beyond its age.
- Which channels connect interest rates and financing costs to business investment.
- What drives investment in automation, food manufacturing equipment and packaging machinery.
Not covered
- Forecasts of cycle tops or bottoms.
- Machine price quotes, model selection and supplier recommendations.
- Plant-level payback and cost calculators.
- Stock tips and trading signals.
A Research Guide to Industrial Capital Spending
Capital spending is where industry conditions become orders for equipment. Researching it well means connecting a buyer’s decision to measurable indicators and being clear about which indicators lead, which lag, and which are only loosely related.
Why the buyer is buying
Every capital project begins with a decision by a business with a specific reason: add capacity, replace worn equipment, meet a regulation, cut labor or change a product. Writing down which reason applies to your sector narrows the indicators that matter. The variable-by-variable approach in the capital expenditure cycle framework is built on this idea, and it lays out what each indicator measures and where it falls short.
Seven checks in order
- Define the sector and the type of equipment being bought.
- Separate maintenance and replacement spending from growth spending.
- Check capacity pressure: are existing plants full?
- Check financing conditions and the cost of capital.
- Check demand signals from the customers of the buying industry.
- Compare shipments and orders data with company disclosures.
- Note signals that would weaken your reading.
Discretion, capacity, age and financing
The first question is how much spending is discretionary. Maintenance versus growth capex explains that the split is usually company-defined and often undisclosed, so it must be estimated with care. The second is whether existing capacity is binding, which capacity utilization and capex addresses by relating utilization data to expansion decisions. Third, equipment may be replaced because of age or because of other pressures, covered in machinery replacement cycles. Fourth comes financing, treated in interest rates and capital expenditure.
The four fit together in sequence. Full plants raise the case for expansion, financing conditions determine whether it goes ahead, and replacement needs provide a floor of activity that is less sensitive to both.
When sector and national data disagree
National series show the direction of the whole manufacturing base, but a sector can behave differently from the total. When you find a gap between the two, check composition: a few large industries can dominate an aggregate, and a quiet average can hide a strong or weak segment. Compare the sector’s own customers, shipments and company commentary with the aggregate before deciding which signal applies.
Series to pull first
For United States manufacturing, the Census M3 survey reports shipments, inventories and orders, which is the closest public view of equipment demand and supply. The Federal Reserve G.17 release reports industrial production and capacity utilization. For investment levels and asset types, the BEA investment in fixed assets tables give a national accounts view. Record the survey’s definition of each series, whether it is seasonally adjusted, and whether the figures are revised.
Common errors in capex research
Survey-based capital expenditure, national accounts investment and company-reported capex use different definitions and coverage, so they should not share one chart without an explanation of the differences. Investment intentions and planned spending are not completed spending, and plans, estimates and reported figures need separate labels.
One strong year of orders can reflect pulled-forward demand or a catch-up after a weak period, so look across the cycle and across indicators. Orders may fall because of financing costs, weak end demand or completed expansion, and each calls for a different reading. Test the alternative explanations explicitly. Capital spending also includes buildings, land, software and vehicles, so only part of it becomes machinery orders.
How the section is organized
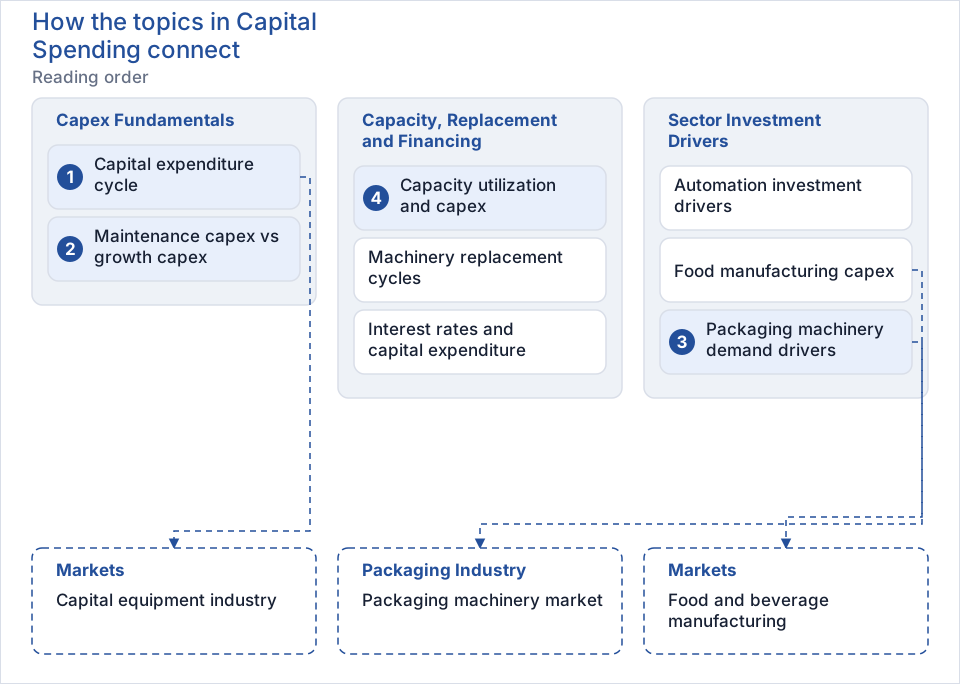
Reading company-level capex also draws on the valuation and company research section, which covers how orders, backlog and cash flow appear in filings. The section has three groups. The fundamentals group defines the cycle and the maintenance and growth split. The second group covers the forces that shape timing: capacity, replacement and financing. The third applies the framework to specific sectors, namely automation, food manufacturing and packaging. A good reading order is the cycle framework, then maintenance versus growth, then packaging machinery demand, then capacity. For sector context, see the capital equipment industry overview in the markets section, which describes how equipment makers earn revenue from these decisions. The packaging application is developed further in packaging machinery demand drivers, which connects to the packaging industry hub.
What this research cannot do
Capital spending research describes conditions and mechanisms. It does not predict when a cycle will turn, and no article here offers investment advice. Each page states its scope, data sources and limitations, and the editorial policy explains how figures are labeled. When indicators conflict, say so plainly and let the conflict stand until more evidence arrives.