
Data Sources for Resource & Industrial Research
These are the primary sources used for research on resources, energy, industrial capital spending, packaging and company disclosures. Each entry links to the publisher's own page rather than to summaries or copies, so readers can check a figure at its origin.
Every entry shows the publisher, what the data covers, how often it is updated, the limits on its use and the date we last checked the link. We open each page before listing it and re-check entries when they are used or updated. Read the usage limits before relying on a series. They note whether figures are actual or forecast, which region and definitions apply, and any licensing terms.

Commodities
Price series for metals, energy, agricultural and other commodities, which put company and sector research in a price context. Check the commodity, unit and period of each series.
| Source | Publisher | Coverage | Update frequency | Use limits | Last checked |
|---|---|---|---|---|---|
| Commodity Markets and Pink Sheet | World Bank | Monthly and annual commodity price data and price indexes for energy, food, beverages, raw materials, fertilizers, metals and precious metals; plus the Commodity Markets Outlook report. | Pink Sheet: monthly. Commodity Markets Outlook: editions published in April and October. | State the commodity, unit and period for every figure. The Outlook contains forecasts; do not present them as actual prices. Terms of use and data licensing are set out in links on the page. | |
| Primary Commodity Prices | International Monetary Fund | Price series from the IMF Primary Commodity Prices System, commodity terms-of-trade indices for 182 economies from 1962, and World Economic Outlook commodity special features. | Monthly, as stated by the publisher. | IMF series and their definitions can differ from other price sources; do not join series from different publishers into one. The page links to a general copyright and usage statement; check it before reuse. |
Energy
Official statistics and outlooks for oil, gas and oil sands. Keep US and global scope apart, and keep actual data apart from forecasts.
| Source | Publisher | Coverage | Update frequency | Use limits | Last checked |
|---|---|---|---|---|---|
| Petroleum & Other Liquids | U.S. Energy Information Administration | US and international data on crude oil, gasoline, heating oil, diesel, propane and other liquids, including prices, production, refining, trade, stocks and consumption. | Varies by product: weekly, monthly and annual releases, as listed on the page. | Check whether a table is US or international. Weekly figures are subject to later revision in monthly and annual releases. Reported data and forecasts are published in separate products. | |
| Short-Term Energy Outlook (STEO) | U.S. Energy Information Administration | Monthly energy forecasts for the US and the world, with projections through the end of the following year and recent history for comparison. | Monthly. | This is a forecast, not reported data. It reflects information available up to its stated input cutoff date and leaves out later events. Cite the edition date, and do not mix forecast values with actuals in one series. | |
| Alberta Energy Outlook (ST98) | Alberta Energy Regulator | Alberta reserves, supply and demand outlooks for crude bitumen (oil sands), crude oil, natural gas, natural gas liquids and coal, with sections on prices, capital spending, pipelines and carbon capture. | Annual. | Covers Alberta only. It has both reserves estimates and forward-looking outlooks, and the page says projections reflect information available at publication and actual results may differ. Cite the edition year. |
Mining & Mineral Valuation
Production summaries and the reporting and valuation codes that govern how mineral resources, reserves and mineral assets are disclosed and valued.
| Source | Publisher | Coverage | Update frequency | Use limits | Last checked |
|---|---|---|---|---|---|
| Mineral Commodity Summaries | U.S. Geological Survey | Annual summaries by mineral commodity covering production, trade, use and other data. The listed 2026 edition has a full report and roughly 90 individual commodity chapters. | Annual; individual chapters and the full report may be revised after release (a version history file is provided). | This link is the folder for the 2026 edition; later editions are published in new folders. Cite the edition and chapter, and check the version history. Many figures are estimates, so read the chapter notes. | |
| VALMIN Code | VALMIN Committee (AusIMM and Australian Institute of Geoscientists) | Australasian code for public reporting of technical assessments and valuations of mineral assets, used in independent expert reports; also gives guidance for petroleum assets. | As published; the 2015 Edition is shown as current on the page. | Check the edition and whether the asset type and jurisdiction fall within its scope. Reading or citing the code does not give this site any certification or qualification to value mineral assets. | |
| CIM Standards, Leading Practices and Guidance for Mineral Resources and Reserves | Canadian Institute of Mining, Metallurgy and Petroleum (CIM) | Hub for the Canadian mineral resource and reserve definitions, leading practice guidelines and the CIMVal standards and guidelines for the valuation of mineral properties. | As published. | This page is a navigation hub; open the specific standard and check its version and effective date. Canadian standards apply to Canadian reporting contexts and may differ from US or Australasian codes. | |
| JORC Code | Joint Ore Reserves Committee (JORC) | Minimum standards for public reporting of mineral exploration results, mineral resources and ore reserves; part of the listing rules for companies on the Australian and New Zealand exchanges. | As published; the 2012 Edition is shown as current, and a draft update went through public consultation in 2024. | Check which edition applies to the report being read. The standard governs reporting, not the quality of a particular estimate. A draft is not the code in force. | |
| Modernization of Property Disclosures for Mining Registrants (Regulation S-K Subpart 1300) | U.S. Securities and Exchange Commission | Final rule (Release Nos. 33-10570; 34-84509) that moved mining property disclosure to a new subpart of Regulation S-K and rescinded Industry Guide 7. | Fixed document; later amendments are published separately. | This is the 2018 adopting release, not the current rule text. It was effective February 25, 2019, with compliance required for fiscal years beginning on or after January 1, 2021. Check the current eCFR text for the rule now in force. Applies to SEC registrants with material mining operations. |
Capital Spending & Industrial Activity
Government statistics on business investment, industrial output, capacity utilization and manufacturers' orders. These are the main public indicators for industrial capital spending research.
| Source | Publisher | Coverage | Update frequency | Use limits | Last checked |
|---|---|---|---|---|---|
| Annual Integrated Economic Survey (AIES) | U.S. Census Bureau | US business revenues, expenses, payroll and employment, replacing and integrating seven annual business surveys. The page notes that the information formerly collected by ACES is now collected through AIES. | Annual; the page shows 2024 as the latest reference year. | US businesses only. Series definitions and coverage changed when AIES replaced earlier surveys, so check the technical documentation before joining AIES figures to ACES history. | |
| Annual Capital Expenditures Survey (ACES), historical | U.S. Census Bureau | US business spending on new and used structures and equipment; the page lists results for 2018 and 2019, COVID-19 impact tables for 2021, and 2022 summary tables. | No longer a standalone survey; the latest data listed is for 2022, published in 2024. | ACES has transitioned to AIES, which began collecting data in March 2024. Use ACES as a historical series only, and check scope and comparability before linking it with AIES. US nonfarm employer companies only. | |
| Industrial Production and Capacity Utilization (G.17) | Board of Governors of the Federal Reserve System | Output, capacity and capacity utilization for US manufacturing, mining and electric and gas utilities, as seasonally adjusted indexes. | Monthly (the release page shows monthly data and a monthly supplement). | US industrial sector only, not global. The latest month is preliminary and subject to revision, and annual revisions can change the index base year. Utilization is a ratio to estimated capacity, not a measure of investment. | |
| Manufacturers' Shipments, Inventories, and Orders (M3) | U.S. Census Bureau | Monthly statistics on shipments, inventories and orders in US manufacturing, with an advance report and a full report each month. | Monthly. | US domestic manufacturers only. Advance figures are revised in the full report and later benchmarks. Orders data describe orders received, not revenue recognized by individual companies. | |
| Investment in Fixed Assets | U.S. Bureau of Economic Analysis | Hub for BEA fixed assets data: fixed assets by type, industry fixed assets and government fixed assets. | Varies by table; see BEA's release schedule. | The hub page has no figures; open the table pages for data. Fixed assets accounts are US national accounts measures and use BEA definitions, which differ from company-reported capital expenditure. |
Packaging Industry
Public pages and trade statistics relevant to packaging machinery. Industry reports are often paid; only publicly available content is described here.
| Source | Publisher | Coverage | Update frequency | Use limits | Last checked |
|---|---|---|---|---|---|
| PMMI Reports: 2026 Southeast Asia Packaging Machinery Market | PMMI, The Association for Packaging and Processing Technologies | Public report page for a PMMI study of packaging machinery demand in six Southeast Asian markets. The page publishes an overview and selected headline statistics. | Single report, listed as published in 2026. | This is an example of a PMMI report page. The full report is paid for non-members, so we cite only what is public on the page, such as the overview and the free executive summary, and do not describe full report content we have not read. Statements are PMMI's own and are not independently verified here. | |
| UN Comtrade Database (HS 8422 packaging machinery trade) | United Nations | International merchandise trade statistics by Harmonized System (HS) code, reporter and partner country. HS heading 8422 includes machinery for filling, closing, sealing, labeling and packing or wrapping. | As reported by national statistical offices; coverage and timing vary by country. | Trade data measure imports and exports, not domestic production or installed base. HS 8422 also contains items beyond packaging machinery, and the HS revision year affects codes. Reporting gaps and mirror-data differences between countries are common. The site loads its data tool by script, so we have confirmed the site is reachable but not tested data queries. |
Company Disclosures
Search tools for company filings, the primary source for company facts. Figures in filings are company-reported and should be cited with report name, period and page or section.
| Source | Publisher | Coverage | Update frequency | Use limits | Last checked |
|---|---|---|---|---|---|
| EDGAR Full-Text Search | U.S. Securities and Exchange Commission | Full text of electronic filings since 2001, searchable by keyword, filer, form type, date range and location. | Updated as filings are submitted. | Covers filings made on EDGAR only, so Canadian-only reporting issuers are not included. Search results point to documents; read the filing itself. Company figures are self-reported. Record the report name, period and page or section when citing. |
How to Use These Sources
The sources below are public pages and datasets, listed in no ranking order. Use them with a clear question, a stated period and an eye on how each publisher defines its figures. The notes here apply to every entry on this page.
Which source answers which question
Start from the question, then pick the area. Each area links to the entries that publish the underlying data.
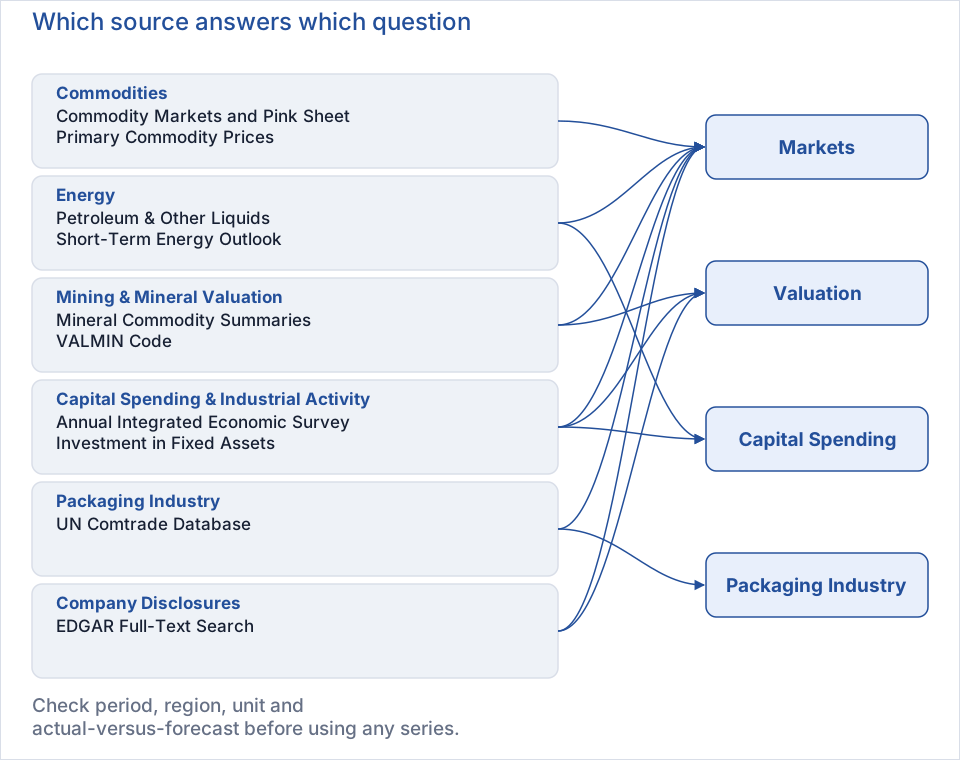
| If you are asking about | Start with |
|---|---|
| Price levels and trends for metals, energy and other commodities | World Bank Pink Sheet and IMF commodity prices |
| Oil supply, trade and forecasts | EIA petroleum data and Short-Term Energy Outlook |
| Mineral production and how mineral assets are reported or valued | USGS summaries and VALMIN |
| Orders, shipments, output and capacity | Census M3 and Federal Reserve G.17 |
| What a specific company reports | EDGAR full-text search |
Match the source to the claim
A government statistical release suits economy-wide or industry-wide measures. A company filing is the primary source for a company’s own figures. A code or standard tells you how a term is defined and says nothing about what a number is. A price series cannot answer a question about company performance, and an industry association page cannot answer one about a single firm, so a source used that way cannot support the claim.
Usage limits come first
Every entry lists coverage, update frequency and usage limits. Read the limits before you copy a figure. They give the geography, the unit, whether the page mixes actual data with forecasts, and what the publisher says about reuse. The capital-spending sources show why, since survey names and scope have changed over time.
Actual data and forecasts
Keep reported data and forecasts apart. The EIA Short-Term Energy Outlook and the World Bank Commodity Markets Outlook contain projections that reflect information available at a cutoff date. Cite the edition, and do not place a forecast value in the same series as an actual one.
Revisions and vintages
Statistical series are revised. A weekly or monthly figure can change in later releases, and an annual summary can be re-issued with corrections. When you record a number, note the release or edition date, the vintage, so someone else can find the same value later. If you compare two periods, use the same release for both where you can.
Units, periods and regions
Write the unit, period and region next to every figure. Check whether a table is US or global, calendar or fiscal year, nominal or adjusted, and whether the unit is a quantity, a value or an index. The Federal Reserve G.17 and Census M3 releases show adjusted and unadjusted series side by side, which is why the capital expenditure cycle article names the exact series it uses.
Licensing and quoting
Public availability does not give permission to republish. Check the publisher’s terms of use on the source page. Cite the name, publisher, date and locator, quote only short passages, and paraphrase the rest, as set out in our editorial policy. Industry association pages such as PMMI reports show only what the publisher makes public, and a paid report should not be described as read unless you have read it. The packaging machinery market article follows that approach, and it uses the trade-classification data under HS 8422 as a separate, public check.
Several sources, separate series
Using several sources for one topic is fine. Joining their series into one line is not. Publishers define scope, weights and units differently, so a break between two series is a definition change and not a trend. Show them side by side, label each, and explain the gap. The same caution applies to codes: VALMIN, CIMVAL and Regulation S-K 1300 have different scopes, and the mining company valuation article treats them as separate reference points and not as one standard. For wider context, see the resource and industrial sector research, the capital spending and company valuation hubs, and the packaging industry research section.