
Packaging industry companies: how to compare their businesses
Key Takeaways
- Classify the actual product and business role before collecting company names.
- Group revenue, packaging-segment revenue and regional revenue answer different questions.
- Annual-report examples illustrate disclosure boundaries; they do not establish a largest-company ranking.
- Keep the source, period, currency, geography and acquisition perimeter beside every comparison.
Research Scope
- Regions
- US research framework; company examples include wider geographic operations
- Period
- 2025 company annual reports; definitions and filings checked October 8, 2026
- Industries
- Packaging materials and containers; machinery and services shown as separate business roles
- Data objects
- Company segments, external sales, product descriptions and comparison metadata
Mixing unlike packaging businesses wastes research time and can produce misleading size comparisons. Classify packaging industry companies by what they produce, where they operate and which revenue measure their annual reports disclose before comparing them.
Start with a material and product boundary, then separate packaging makers from machinery builders and service businesses. Compare company scale only when the period, currency, geography and revenue perimeter match. The annual-report examples below show how reported segments differ; they are a small teaching sample rather than a list of the largest companies. Use the record table to keep each figure attached to its source and unresolved differences.
| Research input | Source to record | Why it changes the comparison |
|---|---|---|
| Material and product form | Business description and segment note | A container business and a machinery business produce different things |
| Revenue boundary | External segment sales and group reconciliation | Group totals can include other activities |
| Region | Geographic disclosure and its definition | Headquarters, factories and sales locations are different filters |
| Period and currency | Annual-report headings and table units | A fiscal year and a current share-price measure describe different periods |
| Ownership perimeter | Acquisition, disposal and discontinued-operation notes | A reported change can include a change in the businesses owned |
Which businesses belong in a packaging-company comparison?
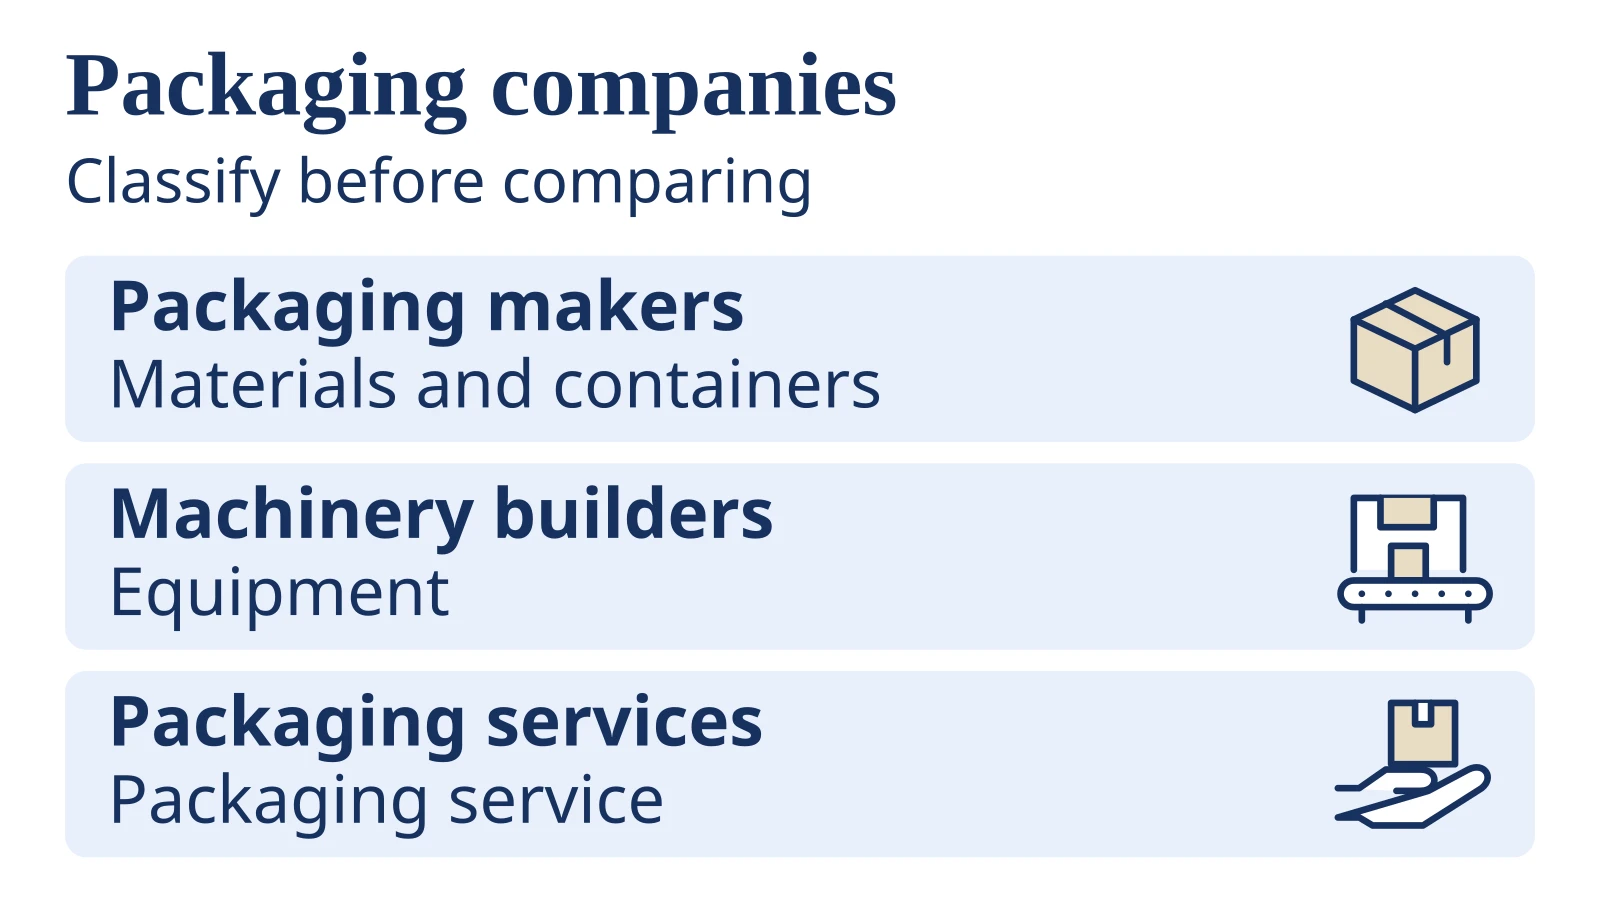
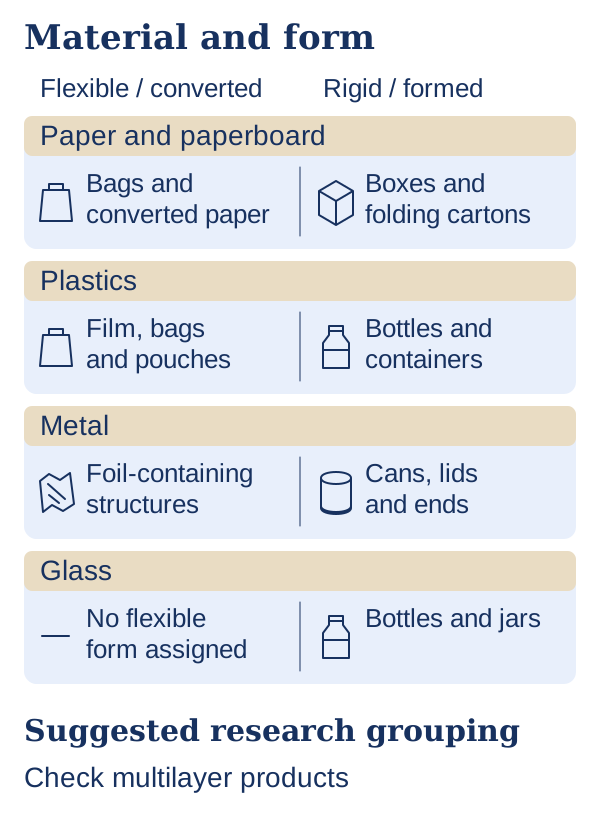
Begin with the output: a packaging material, a container, equipment or a packaging service. Then record the material and form. This is a suggested research classification, not an assignment of official industry codes to companies. A group can occupy several cells, and its reported segments can combine products that your research treats separately.
| Material | Flexible or converted forms to investigate | Rigid or formed containers to investigate |
|---|---|---|
| Paper and paperboard | Paper bags, coated or converted paper | Corrugated boxes and folding cartons |
| Plastics | Film, bags and pouches | Bottles and other formed containers |
| Metal | Foil-containing structures, where disclosed | Cans, lids and ends |
| Glass | No flexible form assigned in this framework | Bottles and jars |
Treat this matrix as a way to ask product questions. A multilayer package can combine materials, so inspect the product description before choosing a cell. Packaging equipment and contract packaging belong in separate business-role columns. The packaging industry research hub provides the wider industry and equipment boundary; the present task is to identify comparable company activities.
For US statistics, selected 2022 NAICS codes provide narrower definitions: 322211 covers corrugated and solid fiber boxes; 322212 folding paperboard boxes; 326111 plastics bags and pouches; 326160 plastics bottles; 327213 glass containers; 332431 metal cans, lids and ends; and 333993 packaging machinery. Read each definition and its cross-references in the official NAICS manual. These examples are not a complete packaging taxonomy.
The Census NAICS introduction identifies business establishments as the classification object. A diversified group’s consolidated accounts describe a different object. Keep its establishments, subsidiaries and reportable segments separate in your records rather than assuming that one code captures all its activities.
End use is another filter. A container maker selling into beverages and a machinery builder serving food processors can share customers while having different revenue models. Use the markets research section to frame customer industries, then verify the actual exposure in company documents.
Takeaway: Select peers by actual products and business roles before using a company’s name or directory category.
What do two verified annual reports actually show?
Packaging Corporation of America (PCA) and Ball illustrate different segment structures. PCA reports Packaging, Paper, and Corporate and Other. Ball’s three reportable segments divide aluminum beverage packaging geographically. Both examples below use the year ended December 31, 2025 and US dollars in millions, but their product and geographic perimeters differ.
| Company and reported line | 2025 sales, USD millions | What the line represents | Filing locator |
|---|---|---|---|
| PCA: Packaging | 8,293.9 | Segment sales to external customers; containerboard and corrugated packaging | Note 19, page 72 |
| PCA: consolidated net sales | 8,989.3 | Whole group, including its other reported activities | Note 19, page 72 |
| Ball: Beverage packaging, North and Central America | 6,286 | Regional aluminum beverage-container segment | Note 3, page 52 |
| Ball: Beverage packaging, EMEA | 3,983 | Regional aluminum beverage-container segment | Note 3, page 52 |
| Ball: Beverage packaging, South America | 2,162 | Regional aluminum beverage-container segment | Note 3, page 52 |
| Ball: Other | 730 | Remaining activities and eliminations described in the note | Note 3, pages 51 to 52 |
| Ball: consolidated net sales | 13,161 | Whole group | Note 3, page 52 |
Source: company disclosures in PCA’s 2025 Form 10-K, filed February 26, 2026, and Ball’s 2025 Form 10-K, filed February 19, 2026. Checked October 8, 2026. These are reported figures, not estimates of market share.
PCA’s Paper segment makes communication papers. Its group total therefore exceeds the Packaging line. The same note states that the acquired Greif containerboard business enters Packaging results from September 2, 2025. Keep that acquisition date beside any year-to-year comparison; reported growth alone does not isolate growth from the previously owned operations.
Ball’s North and Central America segment includes the United States, Canada and Mexico. Calling that line “US packaging revenue” would change its meaning. Its geographic sales table separately attributes revenue by origin of sale, which is another boundary to retain.
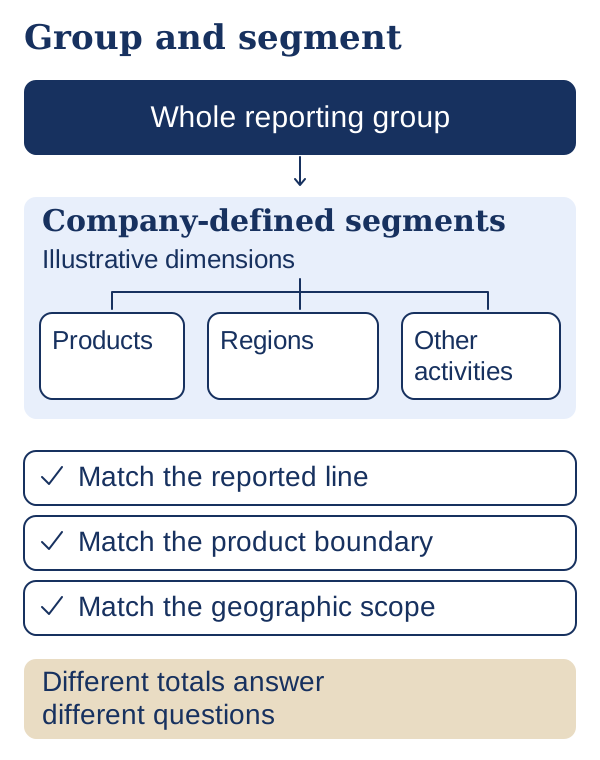
Common mistake: Reading a packaging segment’s name as proof that it covers the same products and countries as another company’s segment.
Takeaway: Preserve the exact reported line and its definition; these examples cannot establish an overall largest-company ranking.
Which measures make a comparison meaningful?
Choose the measure that answers your question, and keep its scope visible. Sales describe reported business activity; a market-value measure answers a valuation question. Physical output and production capacity need their own product definitions and units. None of these measures can stand in for the others simply because a list calls a company “large.”
| Measure or filter | Record beside it | Question it can help answer |
|---|---|---|
| External packaging-segment revenue | Segment products, fiscal year, currency, consolidation scope | How much reported business belongs to this disclosed activity? |
| Group revenue | Activities outside the selected packaging category | How large is the whole reporting group? |
| Production or capacity | Product, unit, site, period, actual output versus stated capacity | What physical activity is being measured? |
| Profit measure | Exact definition, adjustments and reconciliation | How does management report this activity’s earnings? |
| Geographic exposure | Origin of sale, customer location or asset location | Which definition of regional exposure is available? |
| Market value | Valuation date and definition | What value is assigned to the ownership or business claim being studied? |
For financial value, continue with the valuation research section. For activity comparisons, begin with external sales of a matching category. Do not force a company into the table if its disclosure combines products that cannot be separated on the available evidence.
A US screen also needs an explicit rule. A US-headquartered group, a group with US factories and a group earning sales in the United States are different populations. Record which rule you chose and retain the company’s geographic attribution basis. If the files provide only a wider regional segment, label that region rather than estimating an undisclosed US amount.
Directories can help discover candidate names. Use them as leads and attach a primary document before admitting a company to an evidence-based comparison. The data sources directory is a place to start with source types; it does not replace the original report and table locator.
Takeaway: Write the measurement and inclusion rule first; then reject or qualify rows that do not fit it.
How do you find and record the source documents?
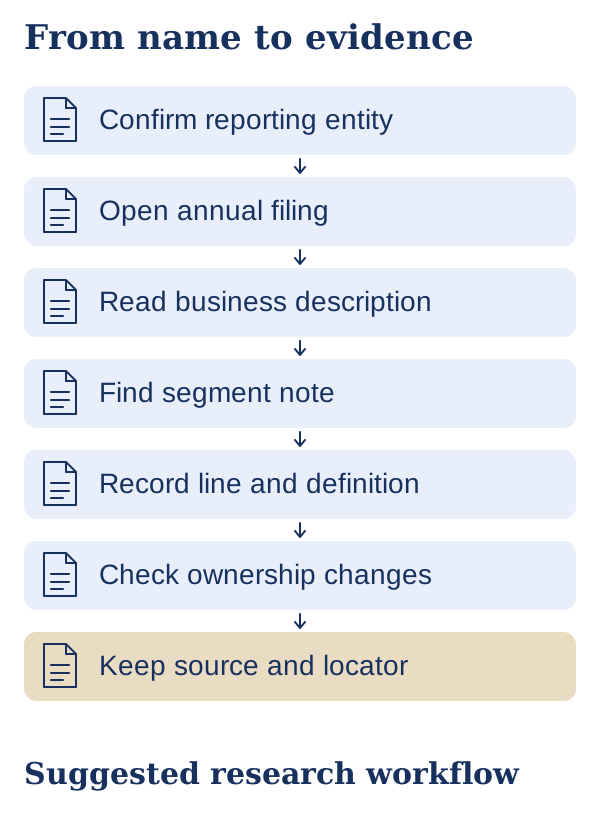
For a US filing example, start at SEC Search Filings with the legal name, ticker or CIK. Filter for Form 10-K, check the reporting period and read the relevant filing. Save the specific report link, table heading and note locator alongside the extracted value so another reader can repeat the check.
- Confirm the reporting entity. A familiar brand can differ from the listed parent named in the filing.
- Open the latest available annual filing and check whether an amendment changes the information you need.
- Read Business for products and customers, then MD&A for explanations of changes.
- Find the segment note in the financial statements. Record external versus intersegment sales and the reconciliation to the group total.
- Read acquisition, disposal and geographic notes before accepting a trend or regional comparison. Check later quarterly filings for developments after the annual period.
The SEC’s 10-K reading bulletin explains the role of these sections. This sequence is a suggested research workflow. Foreign issuers and companies outside the US may use different forms and accounting frameworks, so retain the form and reporting basis in the record.
Food packaging requires a second product check. PCA’s Packaging description identifies meat, fresh produce, processed food and beverages among its applications. That supports a food-related exposure tag for this example; it does not disclose a separate food-packaging sales total or verify compliance for a particular package. Record stated end uses and leave an undisclosed revenue split blank.
| Field in a reusable research row | Entry to retain |
|---|---|
| Entity and document | Legal name, filing type, report URL and accession |
| Activity | Material, product form, business role and stated end uses |
| Reported value | Exact line label, amount, unit and period |
| Boundary | Products, geography definition, ownership changes and eliminations |
| Locator and check | Note, page or table heading, access date and unresolved question |
Copy this record header into your research notes and complete one row per reported activity. A blank field is an evidence gap, not a zero.
Entity | Filing URL and accession | Period | Reported line | Amount and unit |
Product boundary | Geographic basis | Ownership changes | Note/page |
Checked date | Unresolved question
Distinguish quoted disclosure from your own grouping. If you infer a category, label it as an analytical classification and explain which product description supports it. That follows the evidence separation described in the editorial policy.
Takeaway: A usable company row contains a repeatable source check, not just a name and a sales figure.
What should you examine before comparing profitability?
Read the exact profit definition before calculating a margin. PCA’s segment table reports income or loss from operations; Ball reports comparable segment operating earnings with reconciling items. Those labels require review before any comparison. A common currency and fiscal year do not by themselves make profit measures equivalent.
Use the disclosures to form questions about pricing, material costs, freight, product mix and operating conditions. PCA’s segment expense presentation, for example, separates variable costs, fixed costs and freight. Look for management’s explanation of changes rather than attributing every movement in sales to unit demand. These are investigation prompts, not a claim about the profitability of all packaging companies.
The capital spending research hub adds the investment dimension. Ask whether expenditure sustains existing operations, expands capacity or changes product capability. The guide to capital-spending purposes explains those analytical categories. The CapEx and OpEx explanation handles the separate question of capitalization and expense recognition.
Common mistake: Treating an adjusted segment earnings measure as interchangeable with another company’s reported operating profit without checking its reconciliation.
Takeaway: Resolve the earnings definition and investment context before interpreting apparent profit differences.
When this does not apply
This framework cannot select a supplier, verify food-contact suitability or recommend a stock. The small annual-report sample demonstrates disclosure structure; it does not cover every material, private company or geographic market. A comparison can remain incomplete when a company does not disclose the selected activity separately.
| Boundary that blocks a conclusion | Evidence needed to continue |
|---|---|
| Ranking all packaging companies | Defined universe, consistent measure and verified rows for that universe |
| Choosing a package or supplier | Specific product requirements and applicable product-level evidence |
| Comparing physical capacity | Matching product definitions, units and operating assumptions |
| Calling revenue growth organic | A disclosed or supportable bridge for acquisitions, disposals and other effects |
| Inferring market share | A compatible market denominator and company numerator |
| Counting US companies | Industry-code scope, statistical unit, geography and dataset coverage |
For a count, consult the underlying statistical program rather than treating a directory’s length as the industry total. Statistics of U.S. Businesses provides data organized by establishment industry and enterprise size. Company and establishment counts answer different questions. Use the source directory to retain the dataset definition alongside any future count.
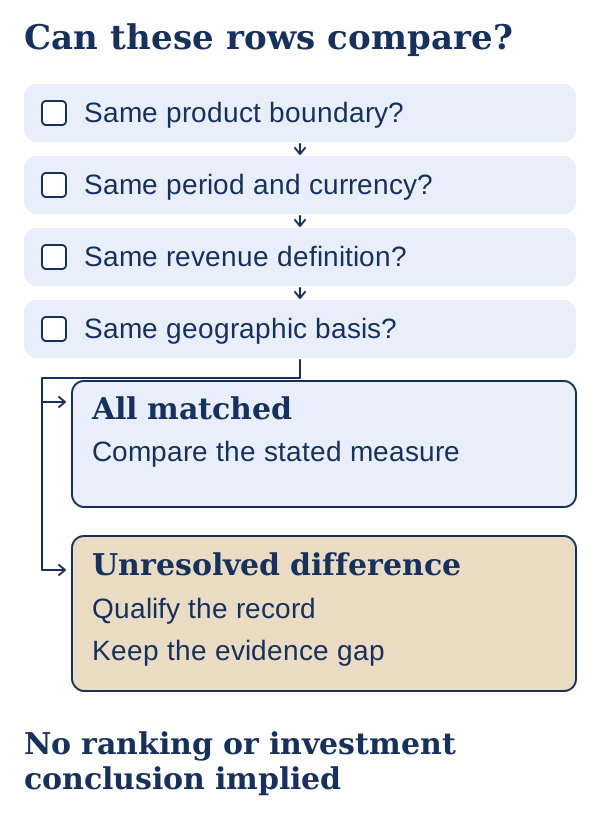
Takeaway: Keep an unresolved field visible and specify the document needed to resolve it.
FAQ
Who is the biggest packaging company?
This page does not identify one. “Biggest” needs a defined universe and metric, such as matching packaging-segment sales for the same period. The two filing examples explain how to check a measure; they are insufficient to establish a global winner.
What are the top 5 packaging companies in the USA?
A defensible list needs a US inclusion rule and verified data for every candidate under the same measure. Headquarters, US production and US sales produce different lists. No five-company ranking was verified for this guide.
What is the largest American packaging company?
First decide what “American” means in the comparison. A company’s wider North American segment cannot automatically be treated as US revenue. A conclusion about the largest company needs a matched dataset beyond the examples provided here.
Which company is best for packaging?
Company scale alone cannot decide that. A buyer needs evidence for the required package, use and supply conditions; an investor has a separate valuation task. The classification record helps organize research but does not certify a supplier or recommend a security.
Is packaging a profitable business?
A positive earnings figure for a selected activity does not establish an industry-wide result. Check the relevant company’s stated profit measure, its reconciliation and the period being studied. This guide does not estimate sector margins or predict returns.
How many packaging companies are there in the USA?
No total is reported here. A count requires selected industry codes, a year, a geography and a distinction between firms and establishments. It also needs the dataset’s coverage rules, which a commercial directory’s headline count may not explain.
What are the four types of packaging?
There is no four-part classification established by this guide. Its matrix uses four material headings as a research aid. Product form, business role and end use are additional dimensions; multilayer packs show why a material-only grouping cannot answer every question.
Takeaway: Define the missing scope or evidence before turning a broad search question into a ranking, count or recommendation.
Method and sources
Compiled from public sources checked October 8, 2026. The company tables reproduce selected reported sales fields from the latest Form 10-K identified for each example in SEC submissions history on that date. Both cover the year ended December 31, 2025. Exact note and page locators appear in the table and source list.
The material matrix, selection rules and record fields are editorial synthesis. No companies were tested, no supplier audit was performed and no market denominator was constructed. The NAICS version is 2022; selected codes illustrate establishment boundaries rather than assigning a code to either company. Later filings can change the comparison record.
Takeaway: Reopen the underlying document when updating a row, and retain its definitions as carefully as its number.
Further reading
- Packaging industry research supplies the wider equipment and industry boundary.
- Types of capital spending distinguishes investment purpose from accounting presentation.
- Data sources helps identify the original datasets behind industry research.
Takeaway: Start the next record with a legal entity and a specific reporting period, then fill the boundary fields before comparing its value.
Continue the research
Related Research
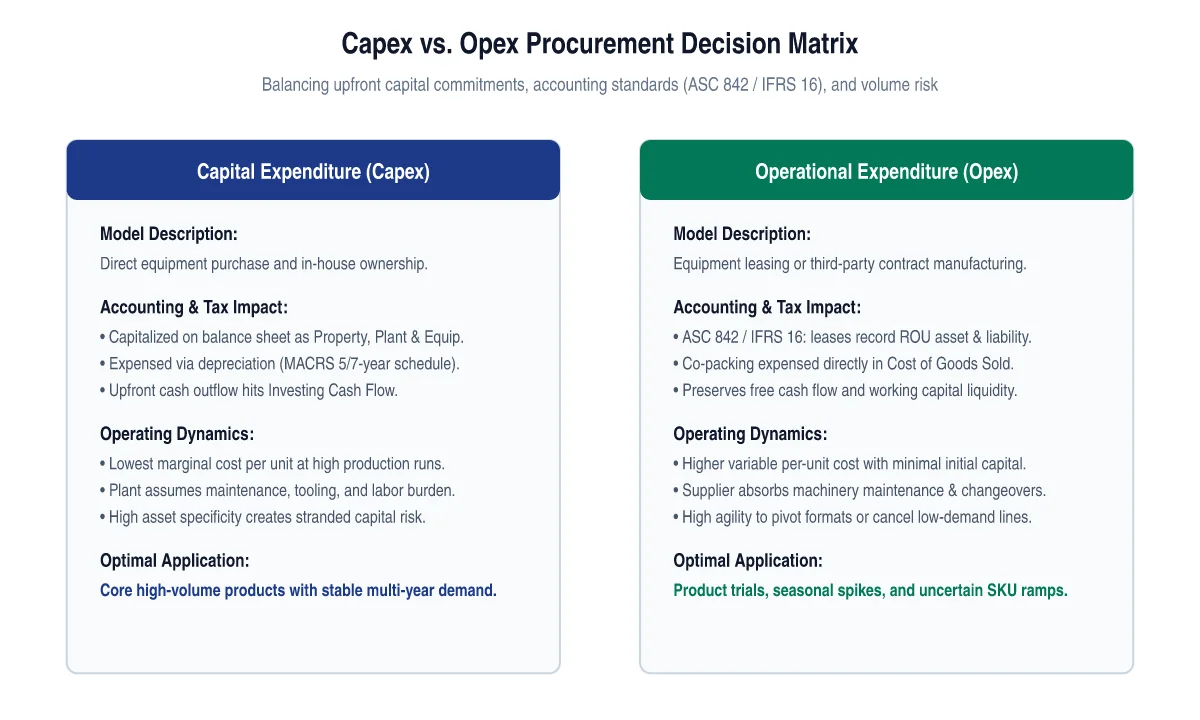
Capex vs Opex in Industrial Manufacturing and Machinery
How do industrial companies evaluate the trade-off between capital expenditure and operational expenditure when acquiring packaging and production capacity?
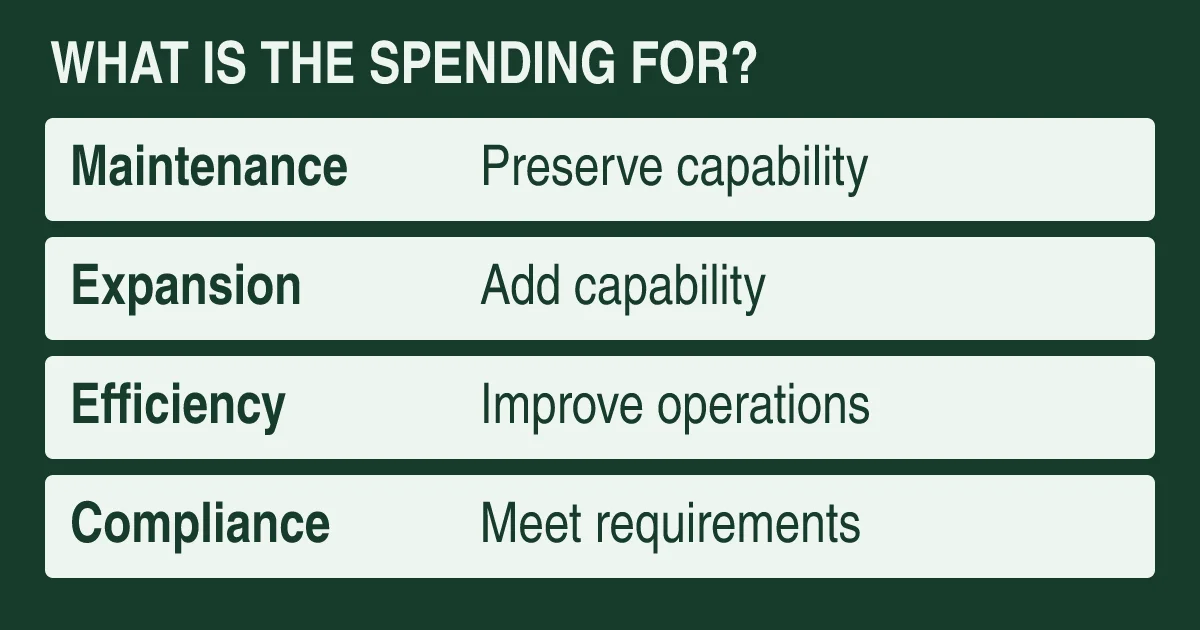
Types of CapEx: Maintenance and Growth
How can a reader identify what capital spending is intended to do without treating a management classification as a standard accounting disclosure?
Sources & Data Notes
-
Filed February 26, 2026. Company-reported segment boundaries and sales, not an independent market ranking.
-
Filed February 19, 2026. Company-reported segment boundaries, geography definitions and sales.
-
Selected establishment classifications, not a complete packaging-company universe.