
Packaging costs: how to read price indexes

Key Takeaways
- A packaging product Producer Price Index (PPI) measures producers' selling-price changes, rather than a packaging manufacturer's total costs.
- Match the product, geography, series ID, units and comparison period before interpreting a change.
- Census manufacturing cost fields provide a separate way to organize materials, payroll and energy research.
- Company margins and investment decisions require company evidence beyond a price index.
Research Scope
- Regions
- United States; domestic producer-price series
- Period
- July and August 2026 index observations; 2018 to 2021 ASM field definitions
- Industries
- Packaging materials and containers; machinery investment treated separately
- Data objects
- Commodity PPIs, manufacturing cost categories and period-comparison metadata
Using the wrong packaging cost index can turn a selling-price movement into a false conclusion about company costs. Match the index to the product and production stage, then compare it with separate evidence on the manufacturer’s inputs.
A packaging cost index is useful only when its coverage matches the question. The US Bureau of Labor Statistics (BLS) packaging product series below track changes in prices received by US producers; they do not measure every expense of making packaging. Use Census manufacturing fields to organize cost research, and compare index observations only on a consistent basis. The worked example shows a change in an official price series, while the research record keeps the company-cost questions separate.
The photographic illustrations on this page are AI-generated. They identify materials and production stages; they are not evidence of a particular factory, machine configuration or production result.
Scroll horizontally to view all columns.
| Research input | Source to record | Why it matters |
|---|---|---|
| Product and material | Exact series title and business description | Paper boxes, plastic packaging and steel containers have different coverage |
| Place in the chain | Purchased input or sold output | The same product can be one firm’s output and another firm’s input |
| Geography | US domestic production for these PPIs | An overseas supply chain needs different evidence |
| Period and frequency | Observation dates; monthly or annual comparison | A monthly change and an annual average answer different questions |
| Units and adjustment | Index base and seasonal status | Index points are not dollars or percentages |
| Cost boundary | Census field definition or company disclosure | A material bill is only part of the company’s cost structure |
Start with the cost boundary
Packaging costs mean different things to a container maker and a business buying containers. Separate purchased materials, the work of converting them, and the selling price of the finished package. The BLS definition concerns selling prices; a cost analysis needs evidence for the inputs as well.
A converter might buy paperboard and sell cartons. A food manufacturer might buy those cartons and use them to ship its product. The carton producer-price index concerns the output price at that stage. It can inform research into a purchaser’s packaging inputs, but it does not describe all costs inside the carton plant. The packaging industry research guide places these activities in the wider value chain.
Table 1. Different meanings of packaging costs. Research categories, without assumed cost shares.
Scroll horizontally to view all columns.
| Question | Relevant evidence | What remains outside it |
|---|---|---|
| What does a packaging maker spend on production inputs? | Materials, payroll, benefits, energy and other expense definitions | The price received for its finished containers |
| How do prices for a packaging product change? | A product-matched producer-price series | A single company’s total cost or margin |
| What does a customer spend on packaging? | Its own invoices, quantities and specification history | A national index cannot reproduce its invoice |
| What does a new line require? | Capital expenditure records and project scope | Recurring material purchases are a separate question |

An investment in machinery also has a different accounting boundary from recurring packaging consumption. The CapEx and OpEx explanation covers that distinction. Keep it separate before trying to connect material price movements with equipment demand.
Takeaway: Write whose cost you are analyzing and which production stage it covers.
Read manufacturing cost categories without double counting
Census Annual Survey of Manufactures (ASM) fields help identify cost categories, but their labels do not form a ready-made company profit statement. Record the table, industry, year and field definition before making a ratio. In particular, a field labeled total cost of materials should not be casually relabeled as raw materials alone.
The Census API identifies table AM1831BASIC01 as Summary Statistics for Industry Groups and Industries in the U.S. for 2018 to 2021, using the 2017 NAICS classification. Its official variable definitions distinguish these items:
Table 2. Selected ASM fields. Labels and units from Census; research uses are suggested here.
Scroll horizontally to view all columns.
| Field | Published label | Unit | Research use |
|---|---|---|---|
| CSTMPRT | Cost of materials, packaging, etc. used | $1,000 | A more specific material-use field to investigate |
| CSTMTOT | Total cost of materials | $1,000 | A broader total whose definition needs checking |
| PAYANN | Annual payroll | $1,000 | Payroll spending, with benefits examined separately |
| BENEFIT | Total fringe benefits | $1,000 | Benefits alongside payroll, rather than wages alone |
| CSTFU | Cost of purchased fuels consumed | $1,000 | Purchased fuel spending |
| CSTELEC | Cost of purchased electricity | $1,000 | Purchased electricity spending |
| CEXMCH | Capital expenditures for machinery and equipment | $1,000 | Investment, kept separate from recurring input analysis |
Use this as a field map. Check the detailed definitions and total/component relationships before adding entries. Do not sum a reported total with components that it already includes. These are historical statistical fields, not estimates of current packaging-company cost shares.
Census describes the establishment as the ASM sampling unit. A multi-plant company’s consolidated accounts therefore have a different boundary. Census also warns that materials costs and shipments can be counted more than once across establishments because one plant’s product becomes another’s material. Suppressed values and missing observations need to stay visibly unavailable. The data sources directory explains why a source’s coverage belongs beside the figure.
For company comparisons, first apply the material, product and region boundaries in the packaging-company comparison guide. A group with several packaging activities cannot be assigned one material’s cost pattern from its name alone.
Takeaway: Keep Census field names and boundaries intact before calculating cost shares.
Match the index to the product
Select a price series by its full title and coverage, not by the word packaging in a search result. Commodity PPIs group similar products, whereas industry PPIs describe an industry’s output. FRED is the Federal Reserve Bank of St. Louis database distributing these BLS observations. The three commodity series below are useful starting points for different packaging products; none is an all-in manufacturing-cost index.
Table 3. Verified BLS commodity series distributed by FRED, checked October 9, 2026. All three are monthly and not seasonally adjusted.
Scroll horizontally to view all columns.
| Product coverage in the series title | BLS/FRED series ID | Units | Boundary to preserve |
|---|---|---|---|
| Paper Boxes and Containers | WPU091503 | Index 1982=100 | Broader than a claim about corrugated boxes alone |
| Plastic Packaging Products | WPU072A | Index December 2006=100 | Packaging products, not a raw-resin price series |
| Steel Cans and Tinware End Products | WPU103102 | Index 1982=100 | Includes tinware; does not stand for every metal container |
The direct series pages are Paper Boxes and Containers, Plastic Packaging Products and Steel Cans and Tinware End Products. Their source notes identify BLS, and their units and frequency identify the comparison basis.

Treat an upstream material series and a finished-container series as separate observations. Their movement is a question to investigate through processing costs and business disclosures. It is not a measured cost pass-through for a named company. Broader industry relationships belong in the resources and industrial sectors section.
Common mistake: Ranking materials by their index levels. Different bases and product baskets mean a larger index number does not identify the more expensive package.
Takeaway: Retain the exact series title, ID and units in the research note.
Read the period before calculating the change
Calculate a percentage change from two observations of the same series on the same basis. An index point change is the subtraction of the levels; a percentage change divides that difference by the earlier level. BLS explains this distinction in its FAQ on interpreting indexes.
Percentage change = (later index / earlier index - 1) × 100
The following readings were displayed by FRED when checked on October 9, 2026. They are US monthly, not seasonally adjusted observations. The series pages displayed an update date of September 10, 2026. This is a dated reading example rather than a live table.
Table 4. Original index observations, with no conversion into packaging prices.
Scroll horizontally to view all columns.
| Series | July 2026 | August 2026 | Index base |
|---|---|---|---|
| WPU091503 | 380.246 | 386.156 | 1982=100 |
| WPU072A | 158.403 | 156.585 | December 2006=100 |
| WPU103102 | 366.164 | 366.709 | 1982=100 |
For Paper Boxes and Containers, the difference is 386.156 - 380.246 = 5.910 index points. Applying the formula gives (386.156 / 380.246 - 1) × 100, or approximately 1.55% from July to August 2026. This publication’s calculation uses the BLS observations distributed by FRED. It does not establish a 1.55% change in any company’s expenses or a customer’s carton bill, and it is not a seasonally adjusted trend estimate.
The same discipline applies to packaging costs in 2023 or any other year. Decide whether the question concerns the average level through the year or the change at year-end. For an annual-average comparison, calculate the average of the year’s complete set of monthly levels and compare it with the preceding year’s average. For December-to-December change, use the two December observations. Name the method and preserve the same series and adjustment basis throughout.
A partially observed year cannot stand in for a full annual average without a different label. Do not use this July-to-August example to infer a 2023 result. A historical comparison needs the historical observations themselves and their publication version.
Common mistake: Calling a 5.910-point increase a 5.910% increase. The earlier index level is the denominator.
Takeaway: State the two periods and calculation method beside every percentage change.
Connect price movements to margins and capital spending
A price movement can prompt a company-research question, but it cannot answer a margin question on its own. Compare the firm’s selling-price evidence with its input costs, volumes and business mix. An output PPI alone cannot tell how much cost a manufacturer absorbed or passed to customers.
A useful reading sequence is to find which materials the company buys, which products it sells, and what its disclosures say about changes in costs and selling prices. Then look for evidence about quantities, inventory accounting and contract terms. Those checks are research suggestions, rather than findings about any particular company. The valuation and company research section provides the wider context for using disclosures.
Keep the investment question distinct. A company considering efficiency spending faces a different decision from one replacing worn equipment or adding capacity. The types of capital expenditure guide separates those purposes; a price index does not identify which applies.

For research into equipment investment, pair the price evidence with disclosed project purpose and capital spending. The capital spending research section is the next step for that analysis. Neither a rising materials index nor a falling one establishes a machinery order forecast.
Takeaway: Use indexes to frame company questions, then answer them with company evidence.
Limitations and uncertainty
These series describe US domestic producer prices for specified product groups. Their coverage limits the conclusions about other countries, imported packages, individual specifications and total manufacturing costs. Preserve those boundaries even when a material’s name resembles the product being researched.
The main restrictions are:
- A product’s producer price and a manufacturer’s input cost are different measures.
- Product groups include a mix of outputs; a particular carton or pouch can have a narrower specification.
- Census industry statistics and consolidated company accounts have different reporting units.
- Historical tables can be revised or benchmarked, and missing cells are not zeros.
- Index observations provide no company cost weights, verified pass-through delay or profit margin.
This method is useful for reading and organizing evidence. It does not provide a package quote, a supplier choice or an investment recommendation. For editorial treatment of assumptions and sources, see the research methodology policy.
Takeaway: Keep the limitation attached to the conclusion that depends on it.
Keep a reusable research record
A reusable record carries definitions as well as numbers. Save the product coverage, series metadata and comparison periods together so that another reader can reproduce the change. Keep company-cost evidence in a separate field; the index calculation does not supply that evidence.
Table 5. A research record to copy into your own notes. Suggested fields, rather than an industry standard.
Scroll horizontally to view all columns.
| Record item | What to enter |
|---|---|
| Research question | Whose cost or selling price, and which packaging product? |
| Source and series | Publisher, URL, full series title and ID |
| Measurement basis | Country, units, index base, frequency and seasonal adjustment |
| Comparison | Earlier period and level; later period and level; calculation |
| Data version | Access date, displayed source update and any revision note |
| Manufacturing-cost evidence | Census table/year/industry/field, or company disclosure and locator |
| Unresolved bridge | Coverage, quantity, contract or accounting differences that remain |

Before interpreting a trend, check that the source and periods match the question at the top of the record. If the remaining bridge is a company cost share or contract reset, leave that field unresolved until the relevant evidence is available.
Takeaway: Make the unanswered part of the cost question visible in the record.
Frequently asked questions
What is the average packaging cost?
An average needs a defined package, quantity, location and expense boundary. BLS publishes price indexes rather than average package prices. Use actual expenditure and quantity records for a cost-per-package question, keeping manufacturing costs separate from a customer’s purchases.
What is the cardboard box index?
That name can describe different measures. WPU091503 is the BLS Paper Boxes and Containers commodity series distributed by FRED. Its title covers more than corrugated boxes alone. Check the full title and scope before treating it as a specific box benchmark.
What is a typical profit margin for a corrugated box business?
A product PPI does not establish a typical margin. Profitability needs a consistent revenue and expense boundary for the businesses and period examined. A national output-price series supplies neither a company’s expense structure nor the comparison sample needed for an industry margin.
Does BLS publish actual prices?
BLS says its PPI publication provides indexes rather than actual or average prices. An index level therefore cannot be read as dollars per carton, kilogram or pallet. A price estimate would require an independently sourced price and a clearly defined product.
Can a published PPI change?
Yes. BLS explains that late reports and corrections can lead to recalculation. Keep the source update and access date in your notes. When reproducing an earlier comparison, check whether its observations and any calculated percentage have changed.
Should I use seasonally adjusted PPIs?
BLS describes adjusted series as useful for short-to-medium-term trend analysis, and unadjusted data as useful for relating indexes to actual-dollar transactions, including cost analysis. The three series here are unadjusted. For a trend with seasonal effects removed, first check whether a series with matching coverage is available.
Method and sources
The series and cost-field tables are compiled from public BLS, FRED and Census sources. FRED distributes the BLS observations; it is not an independent confirmation of the same data. The worked percentage is calculated here from the displayed levels, using BLS’s interpretation of index changes.
The Census table identifies historical manufacturing categories rather than current company cost shares. Census’s April 2025 benchmark release covers 2018 to 2021, so record which version is used in historical research. The sources below include the exact series and field locators needed to repeat the checks.
Takeaway: Preserve the source definitions and data version alongside the calculation.
Continue the research
Related Research
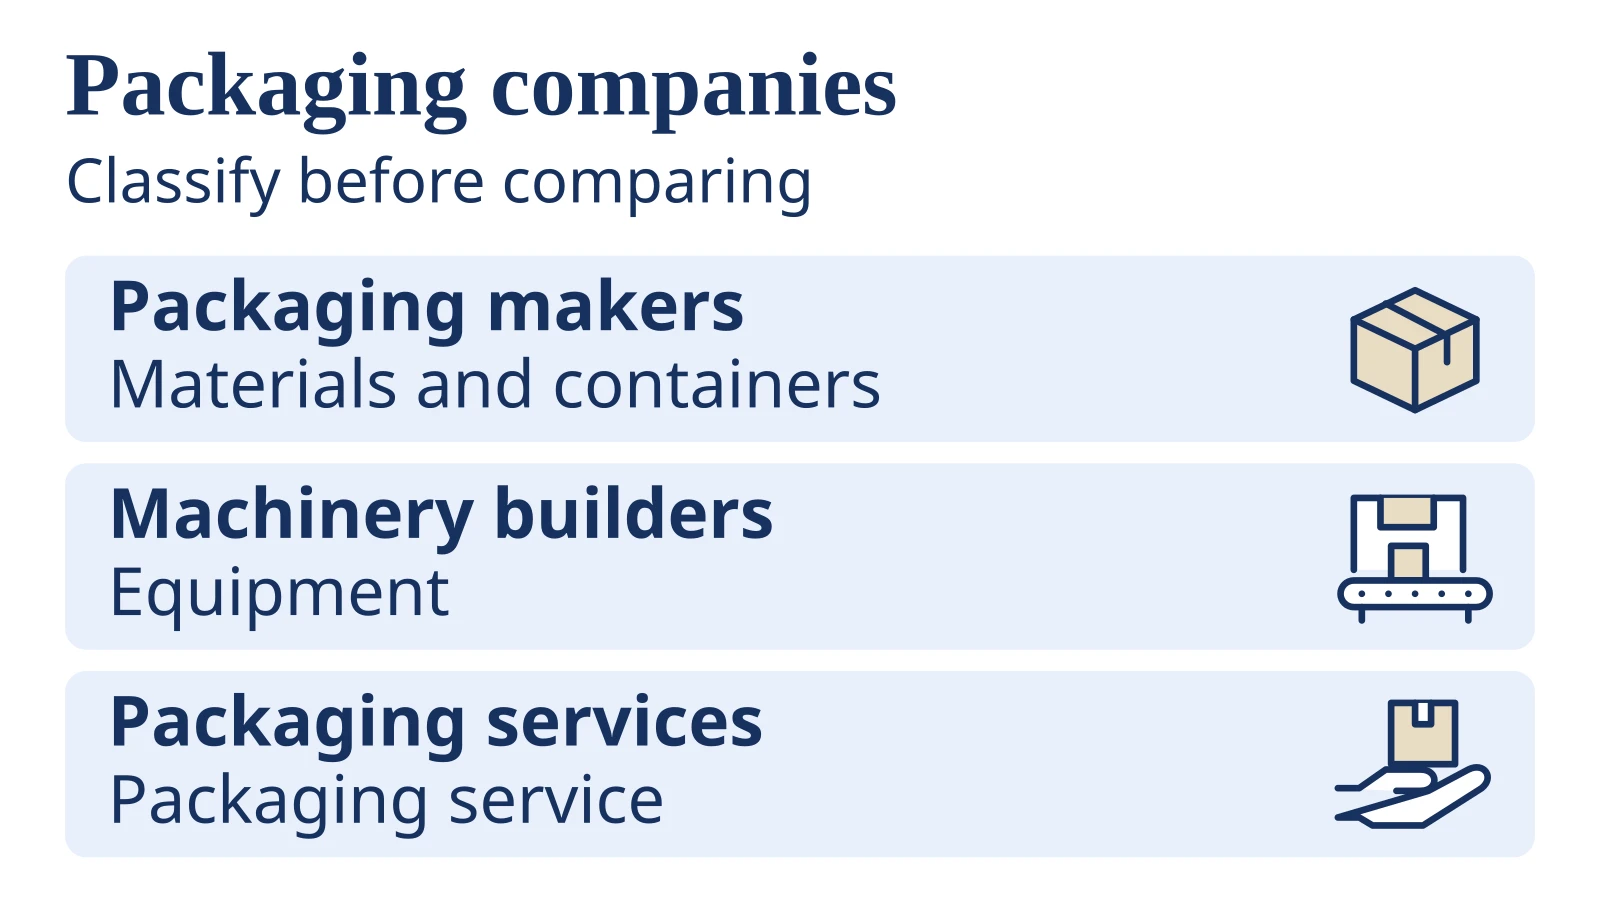
Packaging industry companies: how to compare their businesses
How can readers identify packaging businesses and compare their scale without mixing different revenue, material or geographic boundaries?
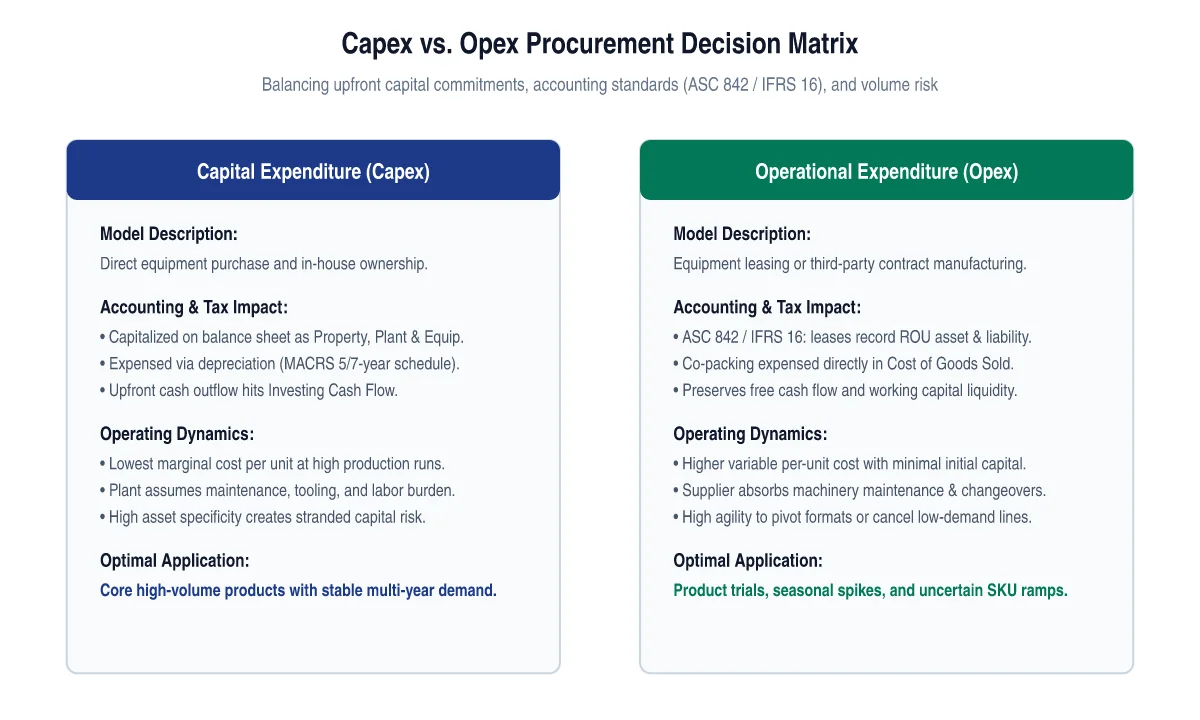
Capex vs Opex in Industrial Manufacturing and Machinery
How do industrial companies evaluate the trade-off between capital expenditure and operational expenditure when acquiring packaging and production capacity?
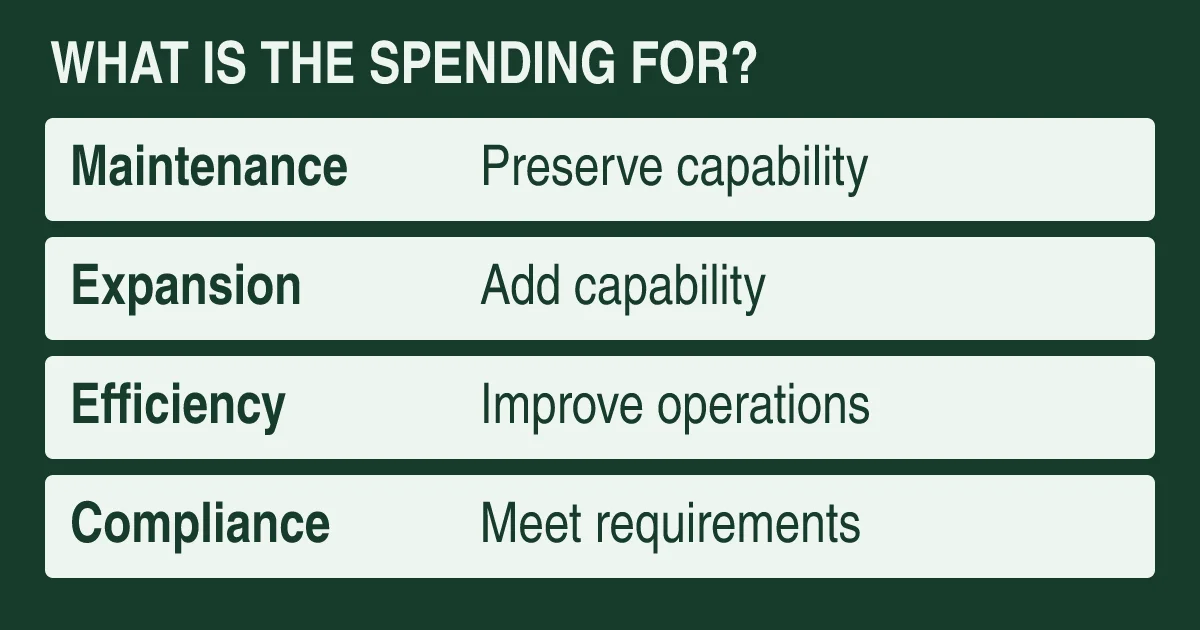
Types of CapEx: Maintenance and Growth
How can a reader identify what capital spending is intended to do without treating a management classification as a standard accounting disclosure?
Sources & Data Notes
-
Definitions of producer prices and the classification boundaries used in the series table.
-
Method and interpretation; no packaging price quote or company cost estimate.
-
Monthly, not seasonally adjusted, index 1982=100. Series page displayed an update of September 10, 2026.
-
Monthly, not seasonally adjusted, index December 2006=100. Series page displayed an update of September 10, 2026.
-
Monthly, not seasonally adjusted, index 1982=100. Series page displayed an update of September 10, 2026.
-
Field names and units for the 2018 to 2021 industry statistics on a 2017 NAICS basis; no industry dollar totals used.
-
Establishment-level scope, aggregation limits and missing or suppressed observations.
-
Shows why the publication version belongs beside a historical cost comparison.