
Manufacturing Company Valuation: Backlog Quality, Capex Intensity & Working Capital Adjustments
Key Takeaways
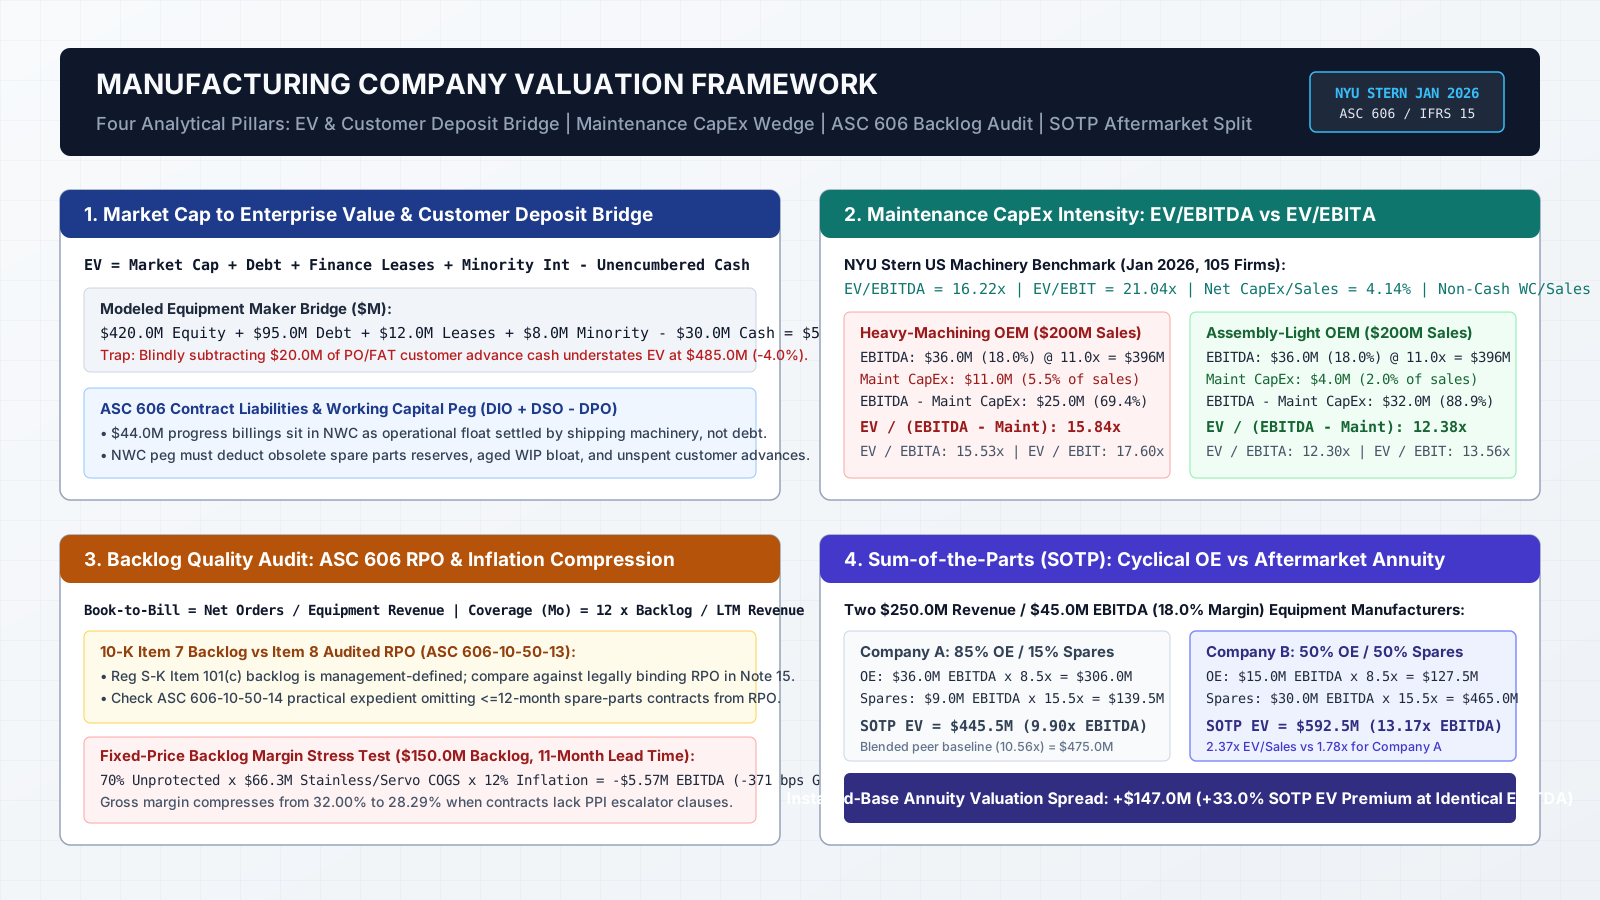
- Enterprise value equals equity market capitalization plus total debt, finance lease liabilities, preferred stock, and noncontrolling interest, minus unencumbered cash after setting aside customer advance float required to build booked orders.
- In NYU Stern's January 2026 U.S. dataset, positive-EBITDA Machinery firms (105 companies) average 16.22x EV/EBITDA and 21.04x EV/EBIT, while Packaging and Container firms (19 companies) average 9.71x EV/EBITDA and 15.78x EV/EBIT.
- Replacing raw EV/EBITDA with EV/EBITA or EV/(EBITDA - Maintenance CapEx) captures physical machine-tool wear without penalizing acquisitive manufacturers for non-cash amortization of deal-related customer intangibles.
- Fixed-price equipment backlog without Producer Price Index (PPI) material escalators suffers direct margin compression during multi-quarter lead times: a 12% rise in stainless steel and servo components across 70% unprotected backlog erodes gross margin by 371 basis points.
- A sum-of-the-parts (SOTP) model applying 8.5x to cyclical original equipment EBITDA and 15.5x to recurring aftermarket EBITDA values a 50/50 aftermarket manufacturer at $592.5M (13.17x blended EBITDA) versus $445.5M (9.90x) for an 85% equipment peer with identical $45.0M EBITDA.
Research Scope
- Regions
- United States sector data from NYU Stern (January 2026 dataset) and SEC Form 10-K / IFRS annual report rules; worked bridge, capex, backlog, and SOTP models use structured calculation inputs.
- Period
- NYU Stern U.S. sector datasets dated January 2026 (last full update January 9, 2026); accounting and regulatory standards verified October 25, 2026.
- Industries
- Industrial machinery, packaging equipment, heavy machining manufacturers, assembly-light original equipment manufacturers (OEMs), and process equipment suppliers.
- Data objects
- Market capitalization, enterprise value bridge, customer contract liabilities (ASC 606 / IFRS 15), remaining performance obligations (RPO), book-to-bill, maintenance vs growth CapEx, EV/EBITDA, EV/EBITA, EV/EBIT, NWC peg, and SOTP segment multiples.
Valuing a manufacturing business on a raw headline earnings multiple fails when unspent customer deposits, deferred machine maintenance, and fixed-price backlog inflation distort cash generation. A defensible manufacturing company valuation bridges equity market capitalization to enterprise value around contract liabilities, deducts maintenance capital expenditure from operating cash flow, stress-tests remaining performance obligations under ASC 606, and separates cyclical equipment sales from recurring aftermarket service revenue.
Industrial and machinery companies combine long-lead-time project accounting with physical plant reinvestment and heavy working capital swings. Before applying any multiple from our valuation research hub or comparing peer groups under company valuation multiples, examine four structural adjustments that determine how much free cash flow an industrial manufacturer actually converts from reported EBITDA.
Scroll horizontally to view all columns.
| Valuation pillar | Primary accounting and statistical inputs | Core formula or adjustment rule | Dominant valuation failure mode |
|---|---|---|---|
| 1. Market cap to enterprise value and customer deposit bridge | Form 10-K Item 8 debt footnote, lease footnote (ASC 842 / IFRS 16), and contract balances note (ASC 606-10-50-8) | EV = Market_Cap + Total_Debt + Finance_Leases + Preferred_Stock + Minority_Interest - Unencumbered_Cash |
Subtracting 100% of reported cash when part of the cash balance comes from unspent customer milestone deposits required to fund work-in-process (WIP) builds |
| 2. Maintenance capex intensity and multiple selection | NYU Stern sector tables, Item 8 cash flow statement (PP&E additions), and intangible asset footnote | EV / (EBITDA - Maintenance_CapEx) and EV / EBITA (adding back acquisition intangible amortization to GAAP EBIT) |
Pricing a vertically integrated heavy-machining plant (5.5% maintenance capex/sales) at the same EV/EBITDA multiple as an assembly-light integrator (2.0% maintenance capex/sales) |
| 3. Backlog quality, book-to-bill, and RPO margin audit | Item 7 MD&A order backlog vs Item 8 Note 15 RPO (ASC 606-10-50-13), Census M3 unfilled orders, and commodity risk disclosures | Backlog_Coverage_Months = 12 × (Ending_Backlog / LTM_Equipment_Revenue) and fixed-price inflation erosion stress test |
Capitalizing peak shipments when book-to-bill sits below 1.0x, or ignoring unindexed stainless steel and servo cost inflation inside multi-quarter fixed-price backlog |
| 4. Sum-of-the-parts (SOTP) and working capital peg | ASC 606-10-50-5 disaggregated revenue (original equipment vs aftermarket spares/service) and 12-month trailing NWC (DIO, DSO, DPO) | EV_SOTP = (EBITDA_OE × Multiple_OE) + (EBITDA_Aftermarket × Multiple_Aftermarket) and NWC_Adj = Closing_NWC - Peg_Target |
Applying a single consolidated multiple to a business with 50% proprietary aftermarket annuity revenue, or failing to deduct obsolete spare-parts reserves from the NWC peg |
Valuation vs market cap in manufacturing: the enterprise value and customer deposit bridge
Calling equity market capitalization the total company price is the most common error when comparing industrial issuers, as established in market cap versus valuation. Market capitalization prices only the common equity claim (Diluted_Common_Shares × Share_Price), whereas Aswath Damodaran’s valuation framework at NYU Stern defines firm valuation (enterprise value) as the claim on the entire operating business supporting debt holders, lease counterparties, preferred shareholders, noncontrolling interests, and common equity holders alike.
For a manufacturing company, bridging from equity market capitalization to enterprise value requires strict handling of two industrial balance-sheet items: customer progress payments (contract liabilities) and equipment leases.
EV = Market_Cap + Total_Debt + Finance_Lease_Liabilities + Preferred_Stock + Minority_Interest - Unrestricted_Unencumbered_CashUnder ASC 606-10-50-8 and IFRS 15, custom machinery and industrial equipment manufacturers routinely collect milestone progress billings across a machine’s build cycle: for example, 30% deposit at purchase order (PO), 40% at factory acceptance testing (FAT), 20% upon shipment, and 10% upon site acceptance testing (SAT). Until the performance obligation is satisfied, those cash receipts sit on the liability side of the balance sheet as Contract Liabilities (deferred revenue or customer advances).
Contract liabilities are operational working-capital float settled by building and shipping machinery rather than repaying principal and interest, so they are not added to financial debt in the enterprise value numerator. However, a major valuation distortion arises on the cash side of the bridge. When an equipment maker collects $20.0 million in upfront PO and FAT milestone deposits just before quarter-end for packaging lines that have not yet entered shop-floor fabrication, reported cash rises by $20.0 million while contract liabilities rise by $20.0 million. If an analyst subtracts the entire reported cash balance from debt to compute enterprise value, the buyer treats cash that is already committed to purchasing stainless steel frames, PLC controls, and assembly labor over the next six months as free cash available to pay down debt.
Rule of thumb: if customer contract liabilities exceed normalized historical working-capital levels or represent upfront deposits on unstarted builds, treat the cash funded by excess customer advances as encumbered working-capital cash and exclude it from the cash subtraction in the enterprise value bridge.
Lease accounting creates a second bridge rule between U.S. GAAP and IFRS filers:
- U.S. GAAP (ASC 842): Finance lease liabilities on CNC machining centers, robotic welding cells, and plant equipment split lease payments into amortization and interest below EBITDA, so finance lease liabilities must be added to enterprise value. Operating lease liabilities are excluded from enterprise value on a standard EV/EBITDA multiple because single straight-line operating lease cost is already deducted inside GAAP operating income and EBITDA.
- IFRS (IFRS 16 Leases): Lessees recognize right-of-use (ROU) assets and lease liabilities for virtually all leases on the balance sheet, replacing operating rent expense with ROU depreciation and lease interest below EBITDA. When valuing an IFRS-reporting manufacturer on EV/EBITDA, add total IFRS 16 lease liabilities to enterprise value so the numerator and denominator match.
The modeled balance-sheet bridge below demonstrates how a $420.0 million market-cap machinery manufacturer reconciles to a $505.0 million enterprise value once debt, finance leases, minority interest, restricted performance-bond cash, and customer deposit float are properly separated.
Scroll horizontally to view all columns.
| Bridge line item | Filing source location | Modeled balance and accounting treatment | Enterprise value bridge action | Common valuation failure mode |
|---|---|---|---|---|
| Diluted common equity market capitalization | Form 10-K cover page and EPS footnote (treasury stock method) | 10.00M diluted common shares × $42.00 closing share price = $420.0M | Starting base: $420.0M | Using basic share count or quoting $420.0M as total enterprise valuation |
| Short-term debt, revolver draws, and senior term debt | Item 8 balance sheet and debt footnote | $95.0M carrying and principal face value of credit facility and senior notes | Add +$95.0M | Omitting seasonal credit-line borrowings or current maturities of long-term debt |
| Finance lease liabilities (ASC 842) | Item 8 leases footnote | $12.0M finance leases on CNC gantry mills (excludes $18.0M U.S. GAAP operating leases expensed inside EBITDA) | Add +$12.0M | Adding U.S. GAAP operating lease liabilities to EV without adding rent back as EBITDAR |
| Preferred stock and noncontrolling interest | Item 8 balance sheet mezzanine / equity section | $8.0M minority interest in a consolidated 80%-owned automation subsidiary | Add +$8.0M | Omitting minority interest from EV while keeping 100% of the subsidiary’s EBITDA in the denominator |
| Unrestricted cash and marketable securities | Item 8 balance sheet, cash flow statement, and ASC 606-10-50-8 contract balances note | $50.0M total unrestricted cash, of which $20.0M is unspent PO/FAT customer advance float needed to fund next 6 months of WIP builds | Subtract -$30.0M unencumbered cash (retain $20.0M inside working capital) | Blindly subtracting all $50.0M of cash, which understates EV by $20.0M (-4.0%) at $485.0M |
| Restricted cash (escrow and warranty bonds) | Item 8 balance sheet and cash footnote | $5.0M pledged as collateral for bank letters of credit and customer performance bonds | $0.0M adjustment (do not subtract unless the paired contingent obligation is added to debt) | Netting restricted performance-bond collateral against senior bank debt |
| Customer contract liabilities (ASC 606 progress billings) | Item 8 Note 15 (ASC 606-10-50-8 contract liabilities) | $44.0M customer milestone deposits on custom equipment in backlog | $0.0M in financial debt (retained inside Net Working Capital peg) | Misclassifying deferred revenue as interest-bearing debt or ignoring its cash unwind when orders slow |
| Implied Enterprise Value (EV) | Reconciled firm claim | $420.0M + $95.0M + $12.0M + $8.0M - $30.0M = $505.0M |
= $505.0M Enterprise Value | 4.0% ($20.0M) valuation error when customer deposit cash float is ignored |
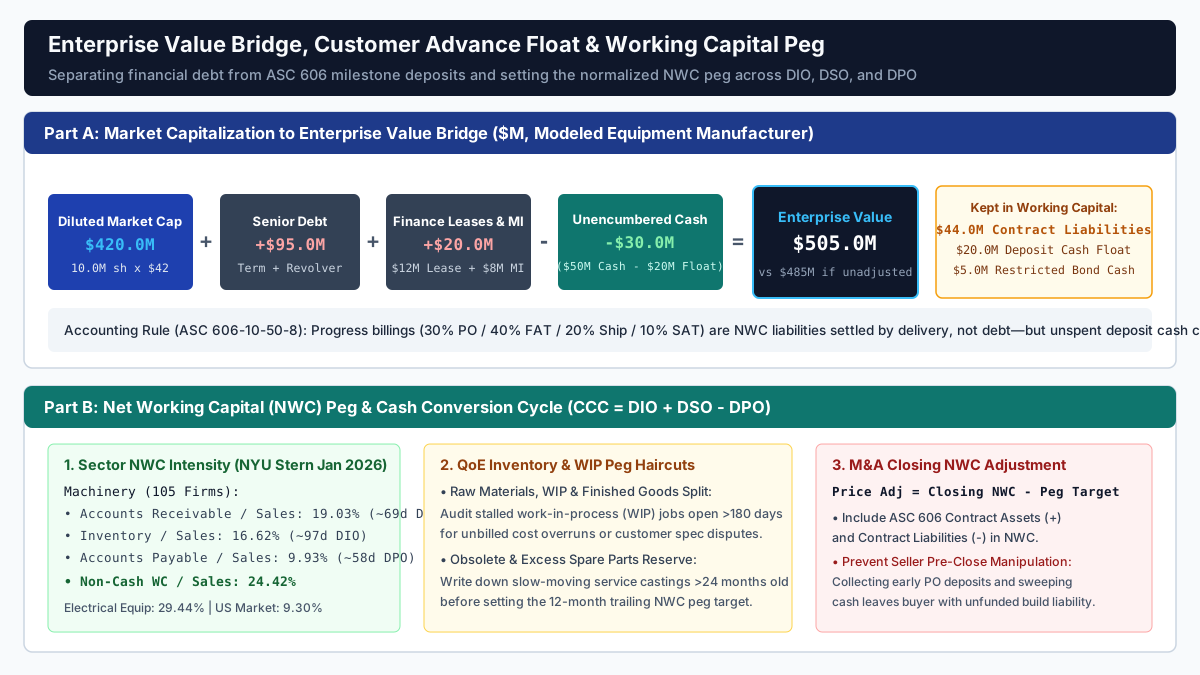
Takeaway: Always pair the enterprise value numerator with the ASC 606 contract balances footnote so upfront customer milestone cash is never double-counted as both debt-paydown cash and self-funded working capital.
Industrial equipment company multiples and maintenance capex intensity
Once enterprise value is established, analysts compare manufacturing company valuation multiples across peer groups. In NYU Stern’s January 2026 U.S. sector datasets (last full update January 9, 2026), sector multiples and capital intensity ratios are calculated from cumulated dollar totals across all U.S.-listed companies in each industry classification, as documented in Damodaran’s variable definitions.
Combining the January 2026 Enterprise Value Multiples, Capital Expenditures, Margins, and Working Capital files reveals how depreciation, capital expenditure, and working capital create wide gaps between EV/EBITDA and EV/EBIT across industrial subsectors.
Scroll horizontally to view all columns.
| U.S. sector classification (NYU Stern, Jan 2026) | Firm count | Positive-EBITDA EV/EBITDA | Positive-EBITDA EV/EBIT | Positive-EBITDA EV/EBIT(1-t) | Implied EBIT ÷ EBITDA | Gross margin | EBITDA margin | EBIT margin | CapEx ÷ Deprecn | Net CapEx ÷ Sales | Sales ÷ Invested Capital | Non-cash WC ÷ Sales |
|---|---|---|---|---|---|---|---|---|---|---|---|---|
| Machinery | 105 | 16.22x | 21.04x | 26.40x | 0.7709 | 37.47% | 19.62% | 15.86% | 67.86% | 4.14% | 1.95x | 24.42% |
| Electrical Equipment | 112 | 24.59x | 43.19x | 61.95x | 0.5693 | 31.82% | 12.65% | 9.53% | 111.06% | 3.08% | 2.03x | 29.44% |
| Engineering / Construction | 48 | 17.18x | 25.17x | 33.40x | 0.6826 | 15.46% | 7.96% | 6.49% | 124.31% | 4.85% | 4.36x | 19.38% |
| Diversified | 20 | 11.42x | 13.49x | 16.36x | 0.8466 | 25.81% | 31.27% | 22.73% | 134.88% | 2.32% | 0.68x | 0.77% |
| Packaging & Container | 19 | 9.71x | 15.78x | 19.92x | 0.6153 | 24.27% | 14.36% | 9.58% | 89.84% | 5.14% | 1.84x | 12.66% |
| Steel | 19 | 11.59x | 24.56x | 33.71x | 0.4719 | 12.25% | 10.58% | 4.10% | 181.25% | 5.69% | 1.80x | 21.61% |
| Total Market (without financials) | 4,822 | 16.95x | 25.70x | 31.97x | 0.6595 | 34.39% | 17.42% | 13.14% | 144.74% | 4.29% | 1.43x | 9.30% |
Three structural features in this January 2026 U.S. benchmark table govern how to value a manufacturing business:
- The depreciation and amortization wedge (
EV/EBIT ÷ EV/EBITDA): InMachinery(105 firms), positive-EBITDAEV/EBITDAis16.22x(all-firms17.46x) whileEV/EBITis21.04x(all-firms21.33x), meaning EBIT represents77.09%of EBITDA and D&A consumes3.76%of sales (19.62%EBITDA margin minus15.86%EBIT margin). In heavy process industries such asSteel(19 firms),EV/EBITDAis11.59xbutEV/EBITjumps to24.56xbecause depreciation and amortization absorb more than half (52.81%) of EBITDA, as analyzed in company valuation multiples by industry cyclicality. - Maintenance versus growth capital expenditure: As detailed in types of capital expenditure and CapEx to-revenue ratio by industry, total capital expenditure combines maintenance CapEx (cash required to replace worn CNC spindles, heat-treat furnaces, tooling, and test rigs to keep existing capacity flat) and growth CapEx (new factory bays, additional machining cells, or greenfield capacity). In EBITDA valuation, two businesses with identical EBITDA generate vastly different free cash flow when their maintenance cash requirements diverge.
- Why
EV/EBITAandEV/(EBITDA - Maintenance CapEx)beat GAAPEV/EBITfor serial industrial acquirers: Industrial machinery compounders frequently grow through bolt-on acquisitions ($10,238.51 millionof cumulated acquisitions across the 105 U.S. Machinery firms in the January 2026 NYU Stern table, exceeding their$4,700.86 millionin physical CapEx). Under U.S. GAAP (ASC 805 / ASC 350) and IFRS 3, acquisitions create customer-relationship, backlog, and technology intangible assets whose non-cash amortization is deducted inside GAAP operating income (EBIT). Because an acquisitive manufacturer does not pay cash to “replace” an amortized acquisition intangible on the shop floor, GAAPEV/EBITunfairly penalizes acquisitive OEMs. Adding back acquisition intangible amortization to reach EBITA (or deducting estimated physical Maintenance CapEx directly from EBITDA) isolates true physical capital consumption.
The worked comparison below places two industrial equipment manufacturers side by side at identical $200.0 million revenue, $36.0 million consolidated EBITDA (18.0% margin), and $396.0 million Enterprise Value (11.00x EV/EBITDA) (equivalent on a scaled basis to $10.0 million EBITDA at a $110.0 million EV). Both companies carry $3.0 million of annual non-cash amortization from prior bolt-on acquisitions.
- Heavy-Machining Manufacturer: Operates in-house casting foundries, 5-axis gantry machining centers, and heat-treatment lines requiring 5.5% of revenue ($11.0M/year) in ongoing Maintenance CapEx ($10.5M PP&E depreciation).
- Assembly-Light Manufacturer: Outsources heavy casting and rough machining to tiered suppliers and focuses on clean-bay mechatronic assembly, PLC control software integration, and FAT testing, requiring only 2.0% of revenue ($4.0M/year) in Maintenance CapEx ($3.8M PP&E depreciation).
Scroll horizontally to view all columns.
| Valuation and cash-conversion metric | Heavy-Machining Manufacturer (in-house foundry & 5-axis mills) | Assembly-Light Manufacturer (outsourced machining & clean-bay assembly) | Spread / valuation impact |
|---|---|---|---|
| Annual revenue | $200.0M | $200.0M | Identical top-line scale |
| Consolidated EBITDA (18.0% margin) | $36.0M | $36.0M | Identical headline EBITDA |
| Enterprise Value at 11.00x EV/EBITDA | $396.0M | $396.0M | Identical headline EV/EBITDA multiple (11.00x) |
| Less: Physical PP&E depreciation | -$10.5M (5.25% of sales) | -$3.8M (1.90% of sales) | -$6.7M heavier physical asset wear |
| Operating EBITA (before deal amortization) | $25.5M (12.75% margin) | $32.2M (16.10% margin) | +$6.7M (+26.3%) higher EBITA for Assembly-Light |
| Less: Acquisition intangible amortization | -$3.0M (1.50% of sales) | -$3.0M (1.50% of sales) | Non-cash deal accounting charge |
| GAAP Operating EBIT | $22.5M (11.25% margin) | $29.2M (14.60% margin) | Distorted by $3.0M non-cash deal amortization |
| Less: Ongoing Maintenance CapEx | -$11.0M (5.50% of sales) | -$4.0M (2.00% of sales) | -$7.0M annual cash drain to hold capacity flat |
| EBITDA minus Maintenance CapEx | $25.0M | $32.0M | +$7.0M/yr (+28.0%) pre-tax cash flow advantage |
Pre-tax cash conversion ((EBITDA - Maint CapEx) ÷ EBITDA) |
69.4% (or $6.94M per $10M EBITDA) | 88.9% (or $8.89M per $10M EBITDA) | +1,950 bps cash conversion advantage |
| Implied EV / EBITDA | 11.00x | 11.00x | Masks the shop-floor capital intensity gap |
| Implied EV / EBITA | 15.53x ($396.0M ÷ $25.5M) |
12.30x ($396.0M ÷ $32.2M) |
Exposes a +3.23x multiple premium on Heavy-Machining |
| Implied EV / GAAP EBIT | 17.60x ($396.0M ÷ $22.5M) |
13.56x ($396.0M ÷ $29.2M) |
Overstates multiple by penalizing M&A intangibles |
| Implied EV / (EBITDA - Maintenance CapEx) | 15.84x ($396.0M ÷ $25.0M) |
12.38x ($396.0M ÷ $32.0M) |
+3.46x effective cash-flow multiple gap |
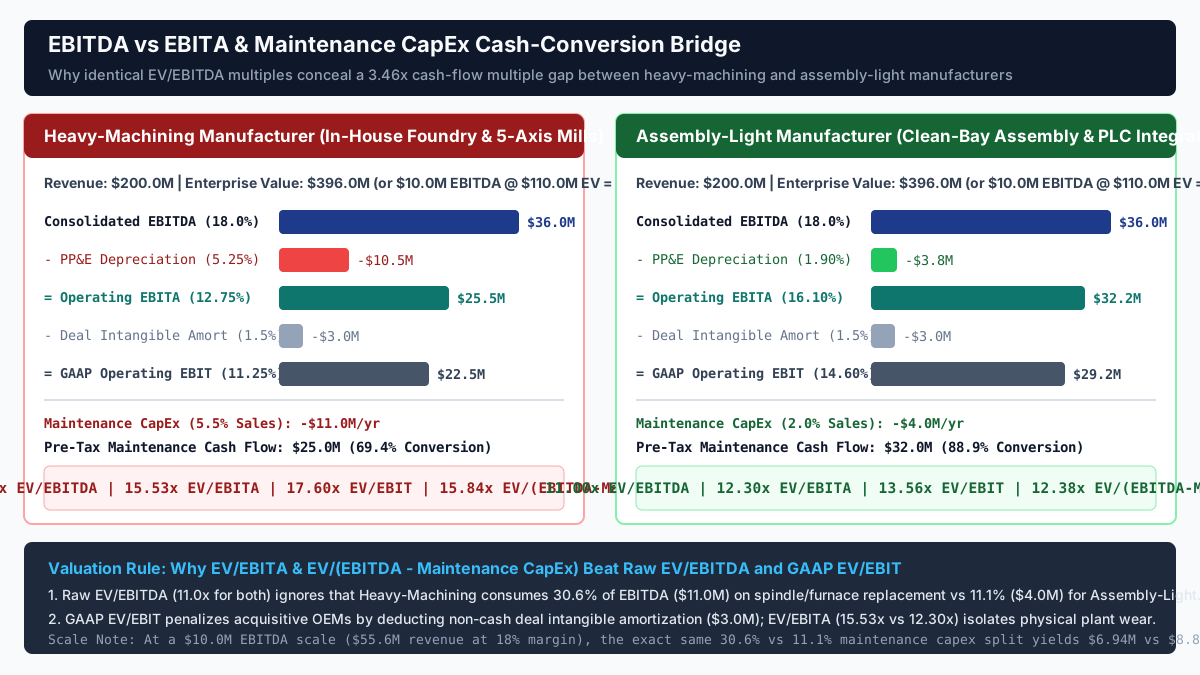
At an identical 11.00x EV/EBITDA multiple, the Heavy-Machining Manufacturer is actually priced at 15.84x pre-tax maintenance cash flow ($396.0M ÷ $25.0M) and 15.53x EV/EBITA, whereas the Assembly-Light Manufacturer trades at 12.38x pre-tax maintenance cash flow ($396.0M ÷ $32.0M) and 12.30x EV/EBITA. Cross-check whether machine outlays are capitalized or expensed through operating leases using CapEx versus OpEx in manufacturing, and verify discounted cash flow terminal reinvestment assumptions against stock valuation formulas.
Takeaway: Never compare EV/EBITDA multiples across manufacturers without normalizing for maintenance CapEx intensity via EV / (EBITDA - Maintenance CapEx) and stripping out non-cash acquisition amortization via EV / EBITA.
Auditing machinery backlog, book-to-bill and remaining performance obligations
In custom machinery, automation, and industrial equipment manufacturing, trailing twelve-month EBITDA reflects orders booked 6 to 18 months ago, while forward cash flows depend on the size, contractual enforceability, and embedded gross margin of the order backlog. At the macro level, the U.S. Census Bureau’s Manufacturers’ Shipments, Inventories, and Orders (M3) survey tracks monthly net new orders (net of cancellations), shipments, and unfilled orders across industrial and metalworking machinery categories.
At the single-company level, securities law creates a critical divide between management-reported backlog in Item 7 (MD&A) and audited Remaining Performance Obligations (RPO) in Item 8 (Financial Statement Footnotes):
- Company-defined backlog under Regulation S-K Item 101(c): Following SEC Release 33-10825, 17 CFR § 229.101(c) uses a principles-based materiality standard rather than a prescriptive statutory backlog formula. As a result, management’s “order backlog” in press releases or Item 7 MD&A can include non-binding distributor letters of intent, multi-year master framework agreements without firm purchase orders, or unexercised customer options.
- Audited Remaining Performance Obligations under ASC 606-10-50-13 and IFRS 15: In Item 8 revenue footnotes, ASC 606-10-50-13 requires registrants to disclose the aggregate transaction price allocated to unsatisfied or partially unsatisfied performance obligations under legally enforceable contracts, along with quantitative or qualitative timing bands explaining when that RPO will convert into revenue (for example, 78% within 12 months and 22% in 13 to 24 months). Under ASC 606-10-50-14, companies may elect a practical expedient to exclude contracts with an original expected duration of one year or less, which often omits short-cycle spare parts and annual service agreements from RPO.
Three quantitative formulas govern the backlog audit in a manufacturing valuation:
Book_to_Bill = Net_New_Orders_Booked / Equipment_Revenue_RecognizedEnding_Backlog = Beginning_Backlog + Net_New_Orders + FX_and_M&A_Adjustments - Revenue_Recognized_from_BacklogBacklog_Coverage_Months = 12 × (Ending_Equipment_Backlog / LTM_Equipment_Revenue)Rule of thumb: if management-reported backlog in Item 7 exceeds audited ASC 606 RPO in Item 8 by more than 25% (after accounting for the <=12-month short-cycle practical expedient), or if the ratio of Contract Liabilities ÷ Backlog drops by more than 500 basis points year-over-year, apply a valuation haircut to unverified backlog growth.
Even when backlog is legally enforceable and backed by deposits, fixed-price backlog duration becomes a margin liability during input-cost inflation. Custom packaging lines, industrial ovens, and metalworking cells require heavy inputs of 304/316L stainless steel plate, machined aluminum, copper motor windings, linear motion rails, and servo drives, which are cost categories tracked in packaging costs and price indexes. If a manufacturer books fixed-price contracts with 9-to-15-month lead times without Producer Price Index (PPI) material escalator clauses, raw-material inflation between order booking and shop-floor fabrication flows straight out of gross margin and EBITDA:
Backlog_Gross_Margin_Erosion = - (Unprotected_Fixed_Price_Backlog_Share) × (Materials_and_Components_Share_of_COGS) × (Input_Cost_Inflation_Rate)Worked backlog margin-compression stress test (modeled inputs):
Consider a packaging machinery OEM carrying $150.0 million of equipment backlog against $163.6 million of LTM equipment revenue, representing an 11.0-month backlog coverage (12 × $150.0M ÷ $163.6M = 11.0 months).
- The $150.0 million backlog was bid and booked at a 32.00% target gross margin ($48.00 million target gross profit; $102.00 million expected COGS).
- Raw materials and purchased mechatronic components (304/316L stainless steel frames, servo motors, drives, and pneumatic manifolds) represent 65.0% of COGS ($66.30 million).
- Contract review reveals that 30.0% of the backlog contains bilateral PPI metal/component surcharge pass-through clauses, while 70.0% ($105.00 million of backlog; $46.41 million of material COGS) is locked at fixed prices with no escalator protection.
- During the 11-month lead time between order booking and shipment, stainless steel and motion-control component prices rise 12.0%.
- Unrecovered material cost inflation equals
0.70 × $66.30M × 12.0% = $5.57 million($5.5692M). - Realized backlog COGS rises from $102.00 million to $107.57 million, cutting realized gross profit from $48.00 million to $42.43 million. Realized gross margin compresses by 371 basis points (from 32.00% down to 28.29%), erasing $5.57 million of forward EBITDA as the backlog ships.
Scroll horizontally to view all columns.
| Backlog stress-test line item | Baseline bid assumptions at booking | Post-inflation realized outcome (12% material spike, 70% unprotected) | Margin and valuation variance |
|---|---|---|---|
Ending equipment backlog (11.0 months coverage) |
$150.00M | $150.00M (fixed top-line price on 70% of orders) | $0.00M revenue pass-through on fixed contracts |
Expected equipment COGS (68.00% of revenue) |
$102.00M | $107.57M ($102.00M + $5.57M unrecovered inflation) |
+$5.57M cost overrun |
Material & servo component share of COGS (65.0%) |
$66.30M | $71.87M (on the 70% unprotected portion: $46.41M × 1.12) |
+8.40% effective total material cost increase |
| Realized backlog gross profit | $48.00M | $42.43M | -$5.57M (-11.6%) gross profit and EBITDA loss |
| Realized backlog gross margin (%) | 32.00% | 28.29% | -371 bps gross margin compression |
| Implied Enterprise Value impact at 11.0x EV/EBITDA | Baseline valuation | -$5.57M EBITDA × 11.0x = -$61.27M |
-$61.3M enterprise value erosion if capitalized |
Takeaway: High backlog coverage only supports a premium valuation multiple when contract footnotes and commercial terms confirm deposit backing, low cancellation exposure, and PPI escalator pass-through protection against raw-material inflation.
SOTP valuation for original equipment and aftermarket service revenue
Applying a single consolidated EV/EBITDA multiple to an industrial manufacturer’s total earnings fails whenever the business combines two distinct economic engines: cyclical Original Equipment (OE) machinery sales and recurring Installed-Base Aftermarket parts, consumables, and field service. Under ASC 606-10-50-5, issuers must disaggregate revenue into categories that depict how economic factors affect the nature, amount, timing, and uncertainty of revenue and cash flows, such as point-in-time spare parts versus over-time capital projects, a pattern also visible across diversified packaging peers in largest packaging companies segment breakdown.
Why do institutional buyers and M&A models value these two streams separately via Sum-of-the-Parts (SOTP)?
- Original Equipment (OE) Systems (typically 7.5x to 9.5x EV/EBITDA; modeled at 8.5x): Driven by customer capital expenditure budgets, greenfield plant expansions, and financing conditions. OE revenue is lumpy, subject to competitive bidding, carries lower EBITDA margins (10% to 17%), and suffers sharp operating deleverage when customer plant utilization drops.
- Aftermarket Parts, Consumables, and Field Service (typically 13.0x to 17.5x EV/EBITDA; modeled at 15.5x): Driven by the cumulative active installed base of machines running on customer factory floors (typically 10-to-20-year operating lives). Proprietary wear parts (sealing jaws, cutting knives, dosing augers, custom gaskets), branded consumables (strapping, stretch film, lidding), preventative maintenance contracts, and PLC software upgrades generate gross margins of 45% to 65% and EBITDA margins of 22% to 30%+ with near-100% cash conversion through industrial recessions.
EV_SOTP = (EBITDA_OE × Multiple_OE) + (EBITDA_Aftermarket × Multiple_Aftermarket) - Unallocated_Corporate_Overhead_EVThe worked Sum-of-the-Parts model below compares two industrial equipment manufacturers, Company A (Greenfield Project OEM) and Company B (Installed-Base Razor/Razor-Blade OEM), that report identical $250.0 million consolidated revenue and identical $45.0 million consolidated EBITDA (18.0% consolidated EBITDA margin) after fully allocating corporate overhead.
Scroll horizontally to view all columns.
| SOTP segment and valuation line | Company A: Cyclical Greenfield OEM (85% OE / 15% Aftermarket) | Company B: Installed-Base Annuity OEM (50% OE / 50% Aftermarket) | Valuation spread (Company B vs Company A) |
|---|---|---|---|
| Consolidated Revenue | $250.0M | $250.0M | $0.0M (identical revenue scale) |
| Consolidated EBITDA (18.0% margin) | $45.0M | $45.0M | $0.0M (identical consolidated EBITDA) |
| Original Equipment (OE) revenue ($M and % mix) | $212.5M (85.0% of sales) | $125.0M (50.0% of sales) | -$87.5M lower cyclical greenfield reliance |
| OE segment EBITDA margin (%) | 16.94% | 12.00% (prices new machines to seed installed base) | -494 bps OE margin (razor/razor-blade strategy) |
| OE segment EBITDA ($M) | $36.0M (80.0% of total EBITDA) | $15.0M (33.3% of total EBITDA) | -$21.0M cyclical OE EBITDA |
Applied OE valuation multiple (EV / EBITDA) |
8.50x | 8.50x | Identical segment multiple |
| OE Segment Enterprise Value ($M) | $306.0M ($36.0M × 8.50x) |
$127.5M ($15.0M × 8.50x) |
-$178.5M OE segment value |
| Aftermarket Spares, Consumables & Service revenue | $37.5M (15.0% of sales) | $125.0M (50.0% of sales) | +$87.5M recurring installed-base revenue |
| Aftermarket segment EBITDA margin (%) | 24.00% | 24.00% | Identical 24.00% aftermarket EBITDA margin |
| Aftermarket segment EBITDA ($M) | $9.0M (20.0% of total EBITDA) | $30.0M (66.7% of total EBITDA) | +$21.0M recurring annuity EBITDA |
Applied Aftermarket multiple (EV / EBITDA) |
15.50x | 15.50x | Identical segment multiple |
| Aftermarket Segment Enterprise Value ($M) | $139.5M ($9.0M × 15.50x) |
$465.0M ($30.0M × 15.50x) |
+$325.5M aftermarket annuity value |
| Total SOTP Enterprise Value ($M) | $445.5M ($306.0M + $139.5M) |
$592.5M ($127.5M + $465.0M) |
+$147.0M (+33.0% SOTP EV premium) |
Implied blended EV / Consolidated EBITDA |
9.90x ($445.5M ÷ $45.0M) |
13.17x ($592.5M ÷ $45.0M) |
+3.27x blended EBITDA multiple expansion |
Implied blended EV / Consolidated Revenue |
1.78x ($445.5M ÷ $250.0M) |
2.37x ($592.5M ÷ $250.0M) |
+0.59x revenue multiple expansion |
Naive consolidated peer multiple benchmark (10.56x) |
$475.0M (overvalues Company A by +$29.5M) | $475.0M (undervalues Company B by -$117.5M) | +$117.5M (+24.7%) premium vs $475.0M peer average |
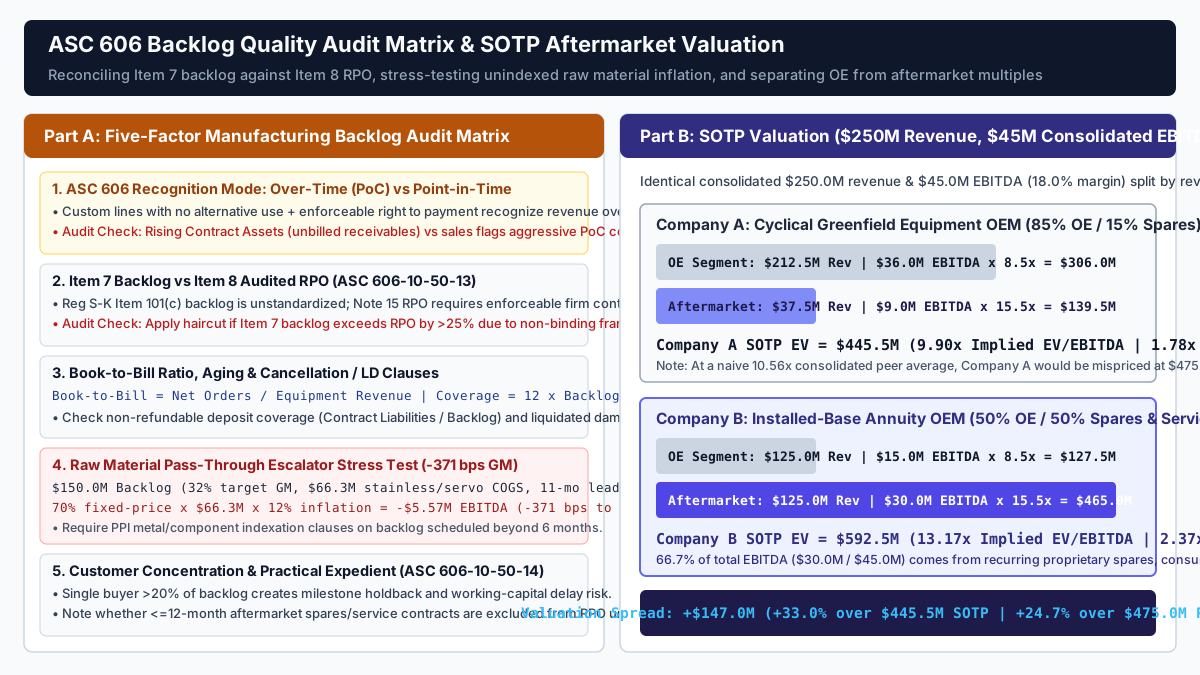
Even though Company A and Company B print the exact same $250.0 million revenue and $45.0 million EBITDA (18.0% margin) on their consolidated income statements, Company B commands a $592.5 million Enterprise Value (13.17x EV/EBITDA) versus $445.5 million (9.90x EV/EBITDA) for Company A, an exact +$147.0 million (+33.0%) valuation premium (or +$147.5 million vs a rounded $445.0 million baseline, and +$117.5 million / +24.7% above a naive $475.0 million consolidated peer multiple of 10.56x). Company B deliberately prices new machines at a 12.00% EBITDA margin to expand its active installed base, capturing two-thirds of its total EBITDA ($30.0 million out of $45.0 million) from high-retention proprietary replacement parts and field service.
Takeaway: Always disaggregate a manufacturer’s revenue and segment profit between new machinery and installed-base aftermarket service before selecting a valuation multiple.
Working capital pegs, inventory aging and cash conversion cycles in manufacturing
Manufacturing is working-capital intensive. In NYU Stern’s January 2026 Working Capital by Sector dataset, the 105 U.S. Machinery companies carry Accounts Receivable/Sales of 19.03%, Inventory/Sales of 16.62%, Accounts Payable/Sales of 9.93%, and Non-cash Working Capital/Sales of 24.42% (compared with 29.44% in Electrical Equipment, 12.66% in Packaging & Container, and 9.30% across the Total Market without financials).
Using the Machinery sector’s 37.47% gross margin (COGS = 62.53% of sales), those January 2026 ratios translate into a long physical Cash Conversion Cycle (CCC):
CCC_Days = DIO + DSO - DPO- Days Sales Outstanding (
DSO = 365 × 19.03%): 69.5 days waiting for milestone and final SAT invoice collection. - Days Inventory Outstanding (
DIO = 365 × (16.62% ÷ 62.53%)): 97.0 days of raw castings, work-in-process (WIP) sub-assemblies, and finished goods sitting on the shop floor. - Days Payable Outstanding (
DPO = 365 × (9.93% ÷ 62.53%)): 58.0 days of supplier credit. - Implied Sector Cash Conversion Cycle:
97.0 + 69.5 - 58.0 = 108.5 daysof cash tied up in operations.
In private manufacturing M&A and public-to-private buyouts, purchase agreements are priced on a “cash-free, debt-free” basis assuming the seller delivers a normalized Net Working Capital (NWC) Peg at closing (typically defined as the trailing 12-month average of Accounts Receivable + Contract Assets + Inventory + Prepaid Expenses - Accounts Payable - Accrued Operating Expenses - Contract Liabilities):
Closing_Purchase_Price_Adjustment = Delivered_Closing_NWC - Target_NWC_PegA rigorous Quality of Earnings (QoE) working capital audit tests three industrial distortion points before locking the NWC peg:
- Work-in-Process (WIP) bloat and unbilled Contract Assets: Under over-time percentage-of-completion accounting, cost overruns on custom engineering projects can accumulate inside WIP inventory or Contract Assets (unbilled receivables) rather than being expensed to COGS. Audit all open shop-floor job orders aged beyond 180 days and write off unrecoverable engineering overruns before computing the 12-month trailing NWC average.
- Obsolete and excess spare parts inventory reserve: Machinery makers often hold slow-moving castings, legacy circuit boards, and service parts for discontinued machine series at full historical cost. Enforce a systematic obsolescence reserve (for example, 50% reserve on inventory SKUs with zero movement over 12 to 24 months and 100% write-down beyond 24 months) so bloated obsolete stock cannot be delivered to satisfy the closing NWC peg.
- Customer deposit (Contract Liability) sweep protection: Because customer milestone deposits (
Contract Liabilities) are a working-capital liability (-), a seller that collects $15.0 million of early PO deposits two weeks before closing and sweeps the cash to equity lowers delivered NWC by $15.0 million. IncludingContract Liabilitiesinside the NWC peg definition forces a dollar-for-dollar purchase price reduction if the seller collects upfront customer cash without leaving that cash on the balance sheet to fund post-closing machine fabrication.
Takeaway: Structure the M&A working capital peg with explicit line-by-line inclusions for ASC 606 contract assets and contract liabilities, and deduct aged WIP overruns and >24-month obsolete spare parts before calculating the 12-month target peg.
Eight-point filing checklist and limitations of the method
Before finalizing any manufacturing company valuation from a Form 10-K or IFRS annual report, run through the eight-point filing checklist below and record each finding alongside the input log format in what is the valuation of a company.
Scroll horizontally to view all columns.
| Audit step | Exact Form 10-K / IFRS filing location | Verification question | Red-flag threshold requiring valuation adjustment |
|---|---|---|---|
| 1. Customer advance cash float in EV bridge | Item 8 Balance Sheet & Note on Contract Balances (ASC 606-10-50-8) | Does reported cash include upfront PO/FAT customer deposits for unbuilt machines? | Contract liabilities surge while WIP has not yet ramped; segregate encumbered deposit cash from the EV cash deduction |
| 2. Lease liability alignment (ASC 842 vs IFRS 16) | Item 8 Leases Footnote | Are finance leases and IFRS 16 operating leases matched to the EBITDA/EBITDAR denominator? | Adding U.S. GAAP operating lease liabilities to EV without adding rent back to EBITDA, or omitting IFRS 16 leases from EV |
| 3. Maintenance CapEx vs PP&E depreciation | Item 8 Cash Flow Statement, PP&E Note & Intangibles Note | How does ongoing physical maintenance CapEx compare with PP&E depreciation and GAAP EBIT? | Gross CapEx trails 65% of PP&E depreciation for 3+ years (deferred shop-floor upkeep) or GAAP EBIT is depressed by M&A intangible amortization |
| 4. Item 7 Backlog vs Item 8 RPO reconciliation | Item 7 MD&A Backlog vs Item 8 Note 15 RPO (ASC 606-10-50-13) | How much of management’s headline backlog is legally enforceable RPO? | Item 7 backlog exceeds audited Item 8 RPO by >25% due to cancelable distributor LOIs or unfunded framework agreements |
| 5. Practical expedient check on short-cycle orders | Item 8 Revenue Footnote (ASC 606-10-50-14) | Did the company omit <=12-month contracts from reported RPO? | Analyst mistakes RPO for total revenue visibility when short-cycle aftermarket spares are excluded under the practical expedient |
| 6. Book-to-bill and deposit coverage ratio | Item 7 Order Intake & Item 8 Contract Liabilities | Are new orders replacing shipments (B/B >= 1.0x) with consistent deposit percentages? |
Book-to-bill drops below 0.85x or Contract Liabilities ÷ Backlog falls from >20% to <10% due to relaxed credit terms |
| 7. Backlog raw-material escalator audit | Item 1A Risk Factors, Item 7A Commodity Risk & Gross Margin Bridge | What percentage of multi-quarter backlog is fixed-price without PPI metal/component indexation? | >50% of >9-month lead-time backlog lacks PPI escalators during steel, aluminum, copper, or servo component inflation |
| 8. Revenue disaggregation & NWC peg reserves | Item 8 Revenue Disaggregation (ASC 606-10-50-5) & Inventory Note | What share of revenue and EBITDA comes from aftermarket spares, and how aged is inventory? | Issuer bundles OE and aftermarket into one line, or inventory footnote shows rising slow-moving/obsolete reserves relative to sales |
Scope and methodological limitations
- Sector aggregates vs single-issuer comparables: The January 2026 NYU Stern U.S. sector benchmarks (
16.22x EV/EBITDAand21.04x EV/EBITfor Machinery;9.71xand15.78xfor Packaging & Container) are value-weighted cumulated sector ratios across listed U.S. companies. They do not indicate whether trailing twelve-month earnings represent a cyclical peak, mid-cycle, or trough year, and they should be paired with the comparability record in company valuation multiples. - Conditional calculation models: The $505.0 million EV bridge, the $200.0 million Heavy-Machining versus Assembly-Light capex matrix, the $150.0 million backlog inflation stress test, and the $250.0 million SOTP comparison are structured calculation models designed to demonstrate accounting and valuation mechanics. When analyzing a specific issuer, substitute the registrant’s audited Item 8 footnote figures and contract terms.
- Segment overhead allocation in SOTP: Many machinery manufacturers report disaggregated revenue between equipment and aftermarket parts under ASC 606-10-50-5 but do not report separate segment EBITDA in Note 18 (Segment Reporting). When segment margins must be estimated from gross margin disclosures and management commentary, test sensitivity across a range of OE and aftermarket margin splits rather than relying on a single point estimate. Explore our capital spending research, packaging industry research, and data sources directory for primary sector benchmarks.
Frequently asked questions
How is manufacturing company valuation different from market cap?
Market capitalization multiplies diluted common shares outstanding by the current share price (10.00M shares × $42.00 = $420.0M), pricing only the common equity claim. Manufacturing company valuation on an enterprise value basis ($505.0M in our modeled bridge) adds total interest-bearing debt ($95.0M), finance lease liabilities ($12.0M), preferred stock, and noncontrolling interest ($8.0M), and subtracts only unencumbered unrestricted cash ($30.0M) after setting aside cash funded by upfront customer milestone deposits ($20.0M).
Are customer deposits and deferred revenue added to enterprise value?
No. Under ASC 606 and IFRS 15, customer milestone deposits and progress billings sit on the balance sheet as Contract Liabilities ($44.0M in the worked bridge) and represent operational working-capital float settled by building and shipping equipment rather than repaying financial debt. However, any unrestricted cash on the balance sheet that came from upfront customer advances for unbuilt machines must be kept inside working capital rather than subtracted from debt when calculating enterprise value.
What is a typical EBITDA multiple for an industrial equipment company, and when does maintenance capex change it?
In NYU Stern’s January 2026 U.S. dataset, positive-EBITDA Machinery companies (105 firms) trade at a cumulated 16.22x EV/EBITDA and 21.04x EV/EBIT, while Packaging & Container companies (19 firms) trade at 9.71x EV/EBITDA and 15.78x EV/EBIT. Whenever two manufacturers have different vertical integration, such as a heavy-machining plant spending 5.5% of sales on maintenance CapEx versus an assembly-light integrator spending 2.0% of sales, raw EV/EBITDA hides the cash-flow gap, and analysts should use EV / (EBITDA - Maintenance CapEx) (15.84x vs 12.38x) and EV / EBITA (15.53x vs 12.30x).
Why do machinery companies with high aftermarket revenue trade at higher valuation multiples?
Original equipment (OE) sales depend on cyclical customer capital budgets and competitive project bidding (often valued around 8.5x EV/EBITDA), whereas aftermarket spare parts, proprietary wear components, consumables, and field service represent a high-margin recurring annuity tied to the active installed base of machines (often valued around 15.5x EV/EBITDA). In a sum-of-the-parts (SOTP) model at identical $250.0M revenue and $45.0M consolidated EBITDA, shifting the revenue mix from 15% aftermarket ($445.5M EV, 9.90x blended EBITDA) to 50% aftermarket ($592.5M EV, 13.17x blended EBITDA) creates a +$147.0M (+33.0%) enterprise value premium.
How do customer deposits and obsolete spare parts affect the working capital peg in manufacturing acquisitions?
In a cash-free, debt-free manufacturing acquisition, the closing purchase price is adjusted dollar-for-dollar against a normalized 12-month trailing Net Working Capital (NWC) peg. Including ASC 606 contract liabilities inside NWC prevents the seller from collecting early customer PO deposits before closing and sweeping the cash without a purchase-price deduction, while enforcing a strict obsolescence reserve on slow-moving spare parts aged beyond 24 months prevents obsolete inventory from inflating closing NWC.
Continue the research
Related Research

Company valuation multiples: pair the claim with the measure
Which valuation multiple matches the claim, and what has to be written down before an industry figure is copied?
EBITDA valuation: same EBITDA, different maintenance cash
How does an EV/EBITDA multiple price an industrial or resource firm, and what does the same EBITDA hide when maintenance cash differs?
Market cap vs valuation: the share-price product is one claim
When is a market capitalization a different object from a firm value or from a valuation estimate?
Sources & Data Notes
-
Provides U.S. sector EV/EBITDAR&D, EV/EBITDA, EV/EBIT, and EV/EBIT(1-t) benchmarks across positive-EBITDA and all-firms samples.
-
Reports cumulated sector Capital Expenditures, Depreciation & Amortization, CapEx/Deprecn, Net CapEx/Sales, and Sales/Invested Capital.
-
Used for January 2026 U.S. sector gross margin, EBITDA margin, EBIT margin, and implied D&A/Sales benchmarks.
-
Reports sector accounts receivable, inventory, accounts payable, and non-cash working capital as percentages of sales.
-
Defines cumulated sector ratio construction and standard balance-sheet and reinvestment formulas.
-
Establishes the separation between firm valuation (FCFF discounted at WACC) and equity valuation (FCFE discounted at cost of equity).
-
Details U.S. GAAP footnote disclosures for contract assets, contract liabilities, revenue disaggregation, and remaining performance obligations (RPO).
-
International accounting standard governing over-time percentage-of-completion revenue, customer advances, and RPO disclosures.
-
Explains why IFRS 16 capitalizes virtually all lessee obligations on the balance sheet with depreciation and interest below EBITDA.
-
Demonstrates that Regulation S-K Item 101(c) uses principles-based disclosure rather than a standardized backlog definition.
-
Official U.S. statistical benchmark for tracking manufacturing order intake, cancellations, unfilled order duration, and inventory-to-shipments ratios.