
Industry valuation multiples and the cycle year

Key Takeaways
- On one January 2026 industry row, EV/EBIT divided by EV/EBITDA is the accounting gap between those two denominators.
- Damodaran's stable-growth example prints 8.24. EBITDA minus capex, divided by the same 0.05 spread, prints 14.
- The multiples page does not say whether January 2026 trailing EBITDA was a peak or a trough.
Research Scope
- Regions
- Damodaran enterprise-value multiples: United States sector file, data as of January 2026. The stable-growth arithmetic has no country and no issuer.
- Period
- Multiples page and current-data index read on 20 October 2026. Multiples page: data as of January 2026, last updated in January 2026. Index: last full update 9 January 2026.
- Industries
- Steel, Packaging & Container, Oil/Gas (Production and Exploration), Software (System & Application), Auto & Truck, and Total Market (without financials). Names are copied from the US file.
- Data objects
- Positive-EBITDA and all-firms EV/EBITDA, EV/EBIT and EV/EBIT (1-t); firm count; the packet's tax, depreciation, capex, WACC and growth inputs.
A peak-year industry EV/EBITDA fails the next trough, because the multiple still carries that peak. The same cell also skips the capital expenditure that Damodaran’s stable-growth formula subtracts before it prints 8.24.
Company valuation multiples already pairs the claim with the measure and keeps the Machinery row as the worked sample. This page takes the next record: how far EV/EBIT sits from EV/EBITDA on cyclical and capital-heavy rows, and what the stable-growth algebra does with tax, depreciation and capex. It does not rank industries, and it does not value a named issuer.

Scroll horizontally to view all columns.
| Industry, as printed | Firms | Positive EV/EBITDA | Positive EV/EBIT | EV/EBIT ÷ EV/EBITDA | EBIT ÷ EBITDA | All-firms EV/EBITDA | Positive EV/EBIT (1-t) | Dominant failure mode |
|---|---|---|---|---|---|---|---|---|
| Steel | 19 | 11.59 | 24.56 | 2.119 | 0.4719 | 11.05 | 33.71 | Treating 11.59 as if depreciation were a small share of EBITDA |
| Packaging & Container | 19 | 9.71 | 15.78 | 1.625 | 0.6153 | 10.78 | 19.92 | Stopping at 9.71 and skipping the EBIT cell on the same row |
| Oil/Gas (Production and Exploration) | 142 | 5.15 | 10.28 | 1.996 | 0.5010 | 6.21 | 13.71 | Reading 5.15 as a mid-cycle cash multiple when the page names no cycle year |
| Software (System & Application) | 309 | 24.48 | 32.41 | 1.324 | 0.7553 | 31.75 | 39.91 | Setting 24.48 next to Steel’s 11.59 as if the wedge were the same |
| Auto & Truck | 33 | 47.76 | 160.32 | 3.357 | 0.2979 | 51.85 | NA | Using 47.76 when the after-tax cell on that row is NA |
| Total Market (without financials) | 4,822 | 16.95 | 25.70 | 1.516 | 0.6595 | 19.87 | 31.97 | Using 16.95 as a hurdle for every industry name |
Table 1. US enterprise-value rows, data as of January 2026, positive-EBITDA columns unless the header says all-firms. EBIT ÷ EBITDA equals the EBITDA multiple divided by the EBIT multiple when both cells share one enterprise-value total. Source: Damodaran, Enterprise Value Multiples by Sector (US), read 20 October 2026. The ratio column is arithmetic on those cells.
The gap between the two cells
Company valuation multiples records a sector row as a peer-group aggregate, and it uses Machinery, 16.22 against 21.04, as that page’s worked row. This page leaves Machinery there. The rows above are the ones where the EBIT cell and the EBITDA cell diverge by a wide margin, or where the after-tax cell is empty.
On an aggregate with one enterprise-value total, EBITDA divided by EBIT equals the EV/EBIT cell divided by the EV/EBITDA cell. EBIT divided by EBITDA is the reciprocal. The share of EBITDA that is not EBIT is one minus that reciprocal. That share is depreciation and amortization in the accounting bridge from EBITDA to EBIT. It is not capital expenditure. The January 2026 page does not print capex.
Steel, positive-EBITDA columns, 19 firms:
24.56 / 11.59 = 2.119
11.59 / 24.56 = 0.4719
1 - 0.4719 = 0.5281
0.5281 of Steel EBITDA is not EBIT on that aggregate. The all-firms EV/EBITDA on the same row is 11.05, close to 11.59. The sample switch moves Steel less than it moves Software (System & Application), where all-firms EV/EBITDA is 31.75 against a positive-EBITDA 24.48. Auto & Truck moves the other way: all-firms EV/EBITDA is 51.85 and the positive-EBITDA cell is 47.76. A positive-EBITDA filter is not a promise of a lower multiple.
Oil/Gas (Production and Exploration) prints 10.28 against 5.15, a ratio of 1.996. EBIT is 0.5010 of EBITDA there. Packaging & Container prints 15.78 against 9.71, a ratio of 1.625, so EBIT is 0.6153 of EBITDA. Software (System & Application) prints 32.41 against 24.48, a ratio of 1.324, so EBIT is 0.7553 of EBITDA. Total Market (without financials) prints 25.70 against 16.95, a ratio of 1.516, so EBIT is 0.6595 of EBITDA. Steel’s 0.5281 gap is wider than that market row. Software’s 0.2447 gap is narrower. Those are two readings of one date. They are not a cheap-to-expensive list.
Auto & Truck is the row that breaks the after-tax column. Positive-EBITDA EV/EBIT is 160.32 and EV/EBIT (1-t) is NA. The all-firms EV/EBIT (1-t) cell is NA as well. NA stays empty. It is not zero, and it is not a reason to fall back on 47.76 as if the tax column had been filled.
Rule of thumb: if the EBIT multiple exceeds 2 times the EBITDA multiple on the same positive-EBITDA row, EBIT is under half of EBITDA for that aggregate. Steel clears it at 2.119. Auto & Truck clears it at 3.357. Oil/Gas production prints 1.996, which stays under 2, with EBIT at 0.5010 of EBITDA.
The firm-count column sits once, outside both sample groups. Company valuation multiples already warns that the count is not a count of positive-EBITDA firms alone. 19 on Steel is the count the page prints. It is not a split by the sign of EBITDA.
What the stable-growth formula subtracts
The spring 2026 packet writes enterprise value as next year’s free cash flow to the firm, divided by the cost of capital minus growth. It then expands that cash flow:
EV = [EBITDA × (1 − t) + Depreciation × t − Capex − change in working capital] / (WACC − g)
Dividing by EBITDA puts four ratios over the same spread. The packet’s example fixes the inputs: tax 36 percent, depreciation equal to 20 percent of EBITDA, capex equal to 30 percent of EBITDA, no working-capital change, cost of capital 10 percent, growth 5 percent. The spread is 0.05.
(1 - 0.36) / (0.10 - 0.05) = 12.8
(0.20 × 0.36) / (0.10 - 0.05) = 1.44
0.30 / (0.10 - 0.05) = 6
12.8 + 1.44 - 6 - 0 = 8.24
Depreciation raises the multiple, because the tax benefit is added. Capex lowers it, and in this example the capex term is larger. The packet states the determinants as the cost of capital, expected growth, the tax rate, and the reinvestment rate. The January 2026 industry file prints none of those four. An 11.59 on Steel is not an 8.24, and an 8.24 is not a target for Steel.
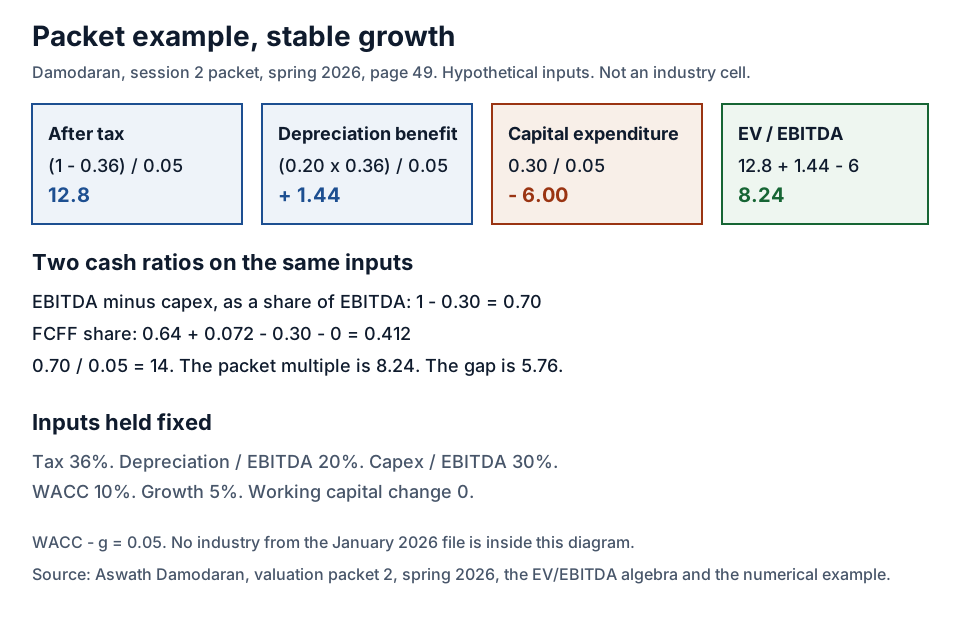
The same inputs give two cash shares. EBITDA minus capex, divided by EBITDA, is the conversion the capex ratio implies:
1 - 0.30 = 0.70
Free cash flow to the firm, as the formula expands it, is a smaller share:
(1 - 0.36) + (0.20 × 0.36) - 0.30 - 0 = 0.412
0.412 / (0.10 - 0.05) = 8.24
0.70 / (0.10 - 0.05) = 14
14 - 8.24 = 5.76
14 is what you print if you capitalize EBITDA after capex and skip the tax terms. 8.24 is what the packet prints. The 5.76 difference is the cost of that skip, inside this example only. EBITDA valuation already shows two mills with one EBITDA total and different maintenance cash. This example is the multiple that results when the capex ratio, the depreciation ratio and the tax rate are written down. Types of capex is where a company’s own spending labels are separated. The packet’s 30 percent is not a maintenance share and not a growth share. It is one combined capex ratio.
Rule of thumb: if capex over EBITDA exceeds the depreciation tax benefit over EBITDA, the capex term cuts the multiple by more than depreciation adds. Here 0.30 exceeds 0.072, and 6 exceeds 1.44.

The year the table does not name
The packet’s relative-valuation checklist asks, under timing, how much cyclicality is in the number, and whether you are using a current, trailing, or forward figure. The current-data index, read 20 October 2026, states a last full update of January 9, 2026. It says the datasets, with a couple of exceptions, are refreshed once a year in the first two weeks, and that the statistics then use the latest figures available, which at the start of the year means trailing 12-month data through the third quarter of the prior year. That sentence is on the index. The multiples table does not reprint it, and it does not mark Steel, oil and gas, or autos as peak or trough.
A trailing EBITDA from a high year, placed under an enterprise value, capitalizes that high year. A trailing EBITDA from a low year does the opposite. The formula above holds growth, tax, and the capex ratio constant. A cyclical year moves the EBITDA you are about to divide into, and it can move the capex ratio at the same time. The table gives you the multiple. It does not give you the year’s position. What a company valuation has to name is where the date and the claim are written before the ratio is reused. Write “unstated” in the cycle field when the filing in front of you has not settled the year.
The positive-EBITDA sample is a second timing choice. Firms with negative EBITDA are out of those columns. In a trough, more firms can fall out, and the firms that remain are the ones whose EBITDA was still positive. Auto & Truck’s NA in the after-tax column is the visible break. Steel’s 11.59 and 11.05 are the quiet case, where the two samples nearly agree and the EBIT cell is still more than twice the EBITDA cell.
Where these figures stop
The 8.24, the 0.70, the 0.412, the 14 and the 5.76 exist only inside the packet’s example. Change the 36 percent tax rate or the 30 percent capex ratio and 8.24 moves. Those inputs are not Steel’s, and they are not the market row’s.
The industry cells are the US file’s aggregates, data as of January 2026, with the sample named beside each cell. The wedge is the accounting gap between EBITDA and EBIT. It is not a capex forecast, and it is not a normalized earnings figure. The packet asks how much cyclicality is in the number. This page’s answer for every row in Table 1 is that the source leaves the cycle year unstated.
The valuation section is where this note sits beside the pairing rule and the EBITDA rebuild. Nothing here is a bid, a price target, or a view on a security. A lower EV/EBITDA on Oil/Gas production than on Software (System & Application) is a difference in the printed cells, including a wider accounting gap on the oil and gas row. It is not a conclusion that one group is cheaper.
Continue the research
Related Research

Company valuation multiples: pair the claim with the measure
Which valuation multiple matches the claim, and what has to be written down before an industry figure is copied?

EBITDA valuation: same EBITDA, different maintenance cash
How does an EV/EBITDA multiple price an industrial or resource firm, and what does the same EBITDA hide when maintenance cash differs?

What is the valuation of a company?
What has to be written down before a company valuation figure can be compared with another figure?
Sources & Data Notes
-
Date of analysis: data used is as of January 2026. Closing line: Last Updated in January 2026. Data used: Multiple data services. Universe in the heading: US.
-
Last full update stated as January 9, 2026. The trailing-twelve-month sentence is about the datasets in general, with a couple of exceptions, and is not reprinted on the multiples table.
-
Spring 2026 packet. The 8.24 example uses a 36 percent tax rate, depreciation at 20 percent of EBITDA, capex at 30 percent of EBITDA, no working-capital change, a 10 percent cost of capital and 5 percent growth.