
What is the valuation of a company?

Key Takeaways
- A company valuation figure is an estimate of a named claim on a named date, for a named purpose.
- Market capitalization, book equity and a model output can all be called value and still measure different things.
- Write down whether each input is a disclosure, an assumption or an estimate before you compare results.
- The worked example uses made-up amounts. It is not a filing and it is not a view on any security.
Research Scope
- Regions
- Method note for readers of SEC filings and IFRS financial statements. The numerical example has no country and no real issuer.
- Period
- Glossary and standards pages checked on 11 October 2026. The example uses a made-up date of 31 December 2025.
- Industries
- Listed industrial and equipment companies, used as the research setting.
- Data objects
- Equity claim, book equity, market capitalization, an earnings multiple and a dividend-growth estimate.
A company valuation is an estimate of a named claim, on a named date, for a named purpose. The quoted price of the shares, the equity line on the balance sheet, and the output of a model can all be called “the value.” They still answer different questions. Until the claim, the date and the purpose are written down, the figures are not ready to be compared.
This page is a research method for industrial and resource companies. It shows how to keep an input log, then walks through one hypothetical listed equipment maker so the arithmetic can be checked. It does not recommend a security, and it does not report a real issuer’s results.
Name the claim before you name a number
Start with four fields. What claim is being valued: the ordinary shares, the shares plus the borrowings, or a single asset? What date do the price and the statements refer to? Which entities are inside the perimeter? What is the purpose: a research comparison, a sale discussion, a tax computation, or a measurement that a filing has to make?
ACCA’s technical article on business valuations lists reasons that include a purchase or sale, a listing, and tax computations. It also notes that a listed company already has a quoted share price, and that the quote does not end the work. A takeover, for example, can change what a buyer would pay for control. The same article separates a majority holder, who can reach earnings and can force a winding up, from a minority holder, who receives the dividends the majority chooses to pay. A minority percentage of the shares is therefore a different claim from a controlling block of the same company.
The valuation section uses that discipline with mining assets and with machinery businesses. This page stays at the prior step: naming the object. Later notes on enterprise value and equity value and on cyclical earnings take up neighboring questions. Those notes are not required to follow the log below.
Table 1. Valuation object record. Source: SRP Blog synthesis of the sources cited on this page.
Scroll horizontally to view all columns.
| Field | What to write down | Hypothetical example entry |
|---|---|---|
| Claim | Ordinary shares, shares plus borrowings, or one asset | All ordinary shares of one equipment maker |
| Date | The day the price or the statements refer to | 31 December 2025, made up for the example |
| Perimeter | Which entities, and which owners | One consolidated group |
| Purpose | Research comparison, sale, tax, or a filing measurement | Compare methods. No bid and no tax return |
| Unit | Currency and scale, as stated | US dollars, in millions |
Takeaway: If two people name different claims, their figures can both be arithmetically right and still disagree.
Three approaches that do different jobs
ACCA’s article groups share valuation into three broad approaches: assets, income, and cash flow.
An assets approach estimates the business from its net assets. The article discusses three versions. Book value carries non-current assets at historical cost less depreciation, and ACCA treats that version as little practical use to a buyer or a seller. Net realisable value is what would remain if the assets were sold and the liabilities settled. For a successful business, ACCA presents that amount as a floor for the sellers, because a going concern also has know-how, brands and customer relationships that a sale of the tangible assets would miss. Replacement cost asks what it would take to assemble the assets again, and it still misses those intangibles unless someone adds an estimate for them.
An income approach, in that article, uses listed companies in a similar business as the pattern. One version is a price/earnings ratio: the price per share divided by the earnings per share. Applying a chosen ratio to an earnings figure produces an estimate of equity value, and only when the earnings match the earnings the ratio was built on. The article’s own grocery illustration uses prices and ratios from 24 December 2011. Those ratios are an example of the method at that date. They are the wrong input for a later year, and this page does not repeat them.
A cash-flow approach in the same article is the dividend valuation model. The idea is that the market value of a share is supported by the present value of future dividends. Using it requires three estimates: the dividend just paid or about to be paid, the return shareholders require, and a future growth rate. The article says the growth rate is often taken from past dividend growth and then assumed to continue. The current dividend is the easy item. The required return and the growth rate are estimates, and they have to fit the business and the borrowing.
None of the three approaches is a universal answer. A breakup floor, a multiple taken from other listed firms, and a dividend model are three research designs. The editorial policy asks the site to keep a reported fact separate from that kind of design choice.
A fair value line in a filing is an exit price for that item
IFRS 13 defines fair value as the price that would be received to sell an asset, or paid to transfer a liability, in an orderly transaction between market participants at the measurement date. The IFRS Foundation’s summary calls that an exit price. The measurement uses the assumptions market participants would use under current conditions, including assumptions about risk. The holder’s plan to keep the asset, or to settle the liability in some other way, is not part of that measurement.
That definition values the asset or the liability named in the measurement. It does not, by itself, value the reporting company’s ordinary shares. A research model that discounts cash flows the owner hopes to receive, at a return the owner requires, is a different exercise from an exit price for a single asset. If a filing contains a fair value amount, copy the item, the measurement date and the level of market evidence the note describes. Then leave it in the log as a disclosure about that item.
Market capitalization is the quoted equity claim
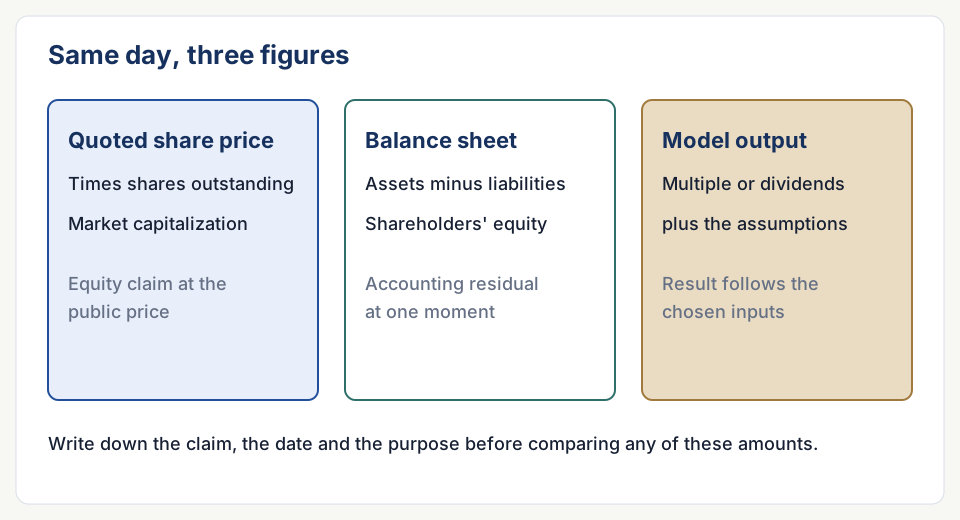
Investor.gov defines market capitalization as the value of a corporation found by multiplying the current public market price of one share by the number of shares outstanding. The date is the date of that public price. The claim is the outstanding equity, at the price the market is quoting for a share.
The SEC’s guide to financial statements describes the balance sheet as what the company owns and owes at a fixed point in time, including shareholders’ equity. The income statement covers what the company made and spent over a period. The cash flow statement covers cash exchanged with the outside world over a period. A share price and a book-equity total can share a date and still rest on different measurement rules. The price is a market quote. Book equity is the residual of assets and liabilities under the accounting policies in the statements.
A research calculation sometimes adds interest-bearing borrowings to market capitalization and subtracts cash. That calculation is not the Investor.gov definition, and it is not a line IFRS 13 requires. It prices a wider set of claims. Label it as its own object, or it will be compared with an equity-only figure by accident.
Keep a log of every input
The object record in Table 1 is useless if the inputs that feed the number are unlabeled. Use three statuses, and use them the same way every time.
Table 2. Input status. Source: SRP Blog synthesis. The statuses are research labels, not accounting categories.
Scroll horizontally to view all columns.
| Status | What it means | What to store with it |
|---|---|---|
| Disclosure | Copied from a filing, a price source or a standard | Document, page or line, date, and the exact label the source uses |
| Assumption | Chosen by the researcher | Why this figure, what alternatives were rejected, and what would change it |
| Estimate | Arithmetic that mixes the other two, or a model output | The formula in words, the inputs, and the claim the result refers to |
A missing input stays missing. If the filing has no net realisable value for the plants, the assets approach cannot be finished by typing a round number into the gap. The data sources directory is where this site points readers who need the underlying series or the filing search, rather than a chart with no locator.
Takeaway: An estimate without its disclosures and assumptions cannot be updated when the next filing arrives.
A public-company example with made-up figures
Illustrative example (hypothetical figures, not company data): the rows below pretend to describe one listed equipment manufacturer on 31 December 2025. No filing was consulted for these amounts. “Disclosure” in the status column means the row plays the role a filing line or a price quote would play. It does not mean a company reported it.
Table 3. Input log for the hypothetical equipment maker. Amounts are invented.
Scroll horizontally to view all columns.
| Input | Amount | Status in the example | Role |
|---|---|---|---|
| Shares outstanding | 100 million | Disclosure | Denominator of the equity claim |
| Public share price | $20 | Disclosure | Price on the made-up valuation date |
| Interest-bearing borrowings | $400 million | Disclosure | A claim that is not ordinary equity |
| Cash | $100 million | Disclosure | Cash still inside the group |
| Shareholders’ equity | $900 million | Disclosure | Balance-sheet residual |
| Profit after tax | $80 million | Disclosure | Earnings used with the multiple |
| Dividend just paid | $30 million | Disclosure | Starting cash distribution |
| Price/earnings ratio | 12 | Assumption | Chosen for the illustration, not observed |
| Dividend growth | 3 percent a year | Assumption | Assumed to continue |
| Required equity return | 9 percent | Assumption | Chosen for the illustration |
The arithmetic, step by step:
Market capitalization is 100 million shares times $20, which is $2,000 million. That uses two disclosure-role inputs and the Investor.gov definition. Status of the product: estimate of the quoted equity claim.
Book equity stays $900 million. Nothing is calculated. Status: disclosure-role residual. It is already an amount, and it measures the accounting residual.
The earnings estimate multiplies the assumed ratio of 12 by after-tax profit of $80 million. The product is $960 million. Status: estimate of equity value under that assumption. It matches the equity claim only if a ratio of 12 was built on after-tax profit of the same kind. This example simply assumes that match.
The dividend model follows the structure in the ACCA article: start from the dividend just paid, grow it one year, and divide by the gap between the required return and the growth rate. Next year’s dividend is $30 million times 1.03, which is $30.9 million. The gap is 9 percent minus 3 percent, which is 6 percent. $30.9 million divided by 0.06 is $515 million. Status: estimate of equity value under those two assumptions. The growth rate and the required return do all of the work. The $30 million dividend, on its own, does not produce $515 million.
A wider research total adds the $400 million of borrowings to the $2,000 million market capitalization and subtracts the $100 million of cash. The result is $2,300 million. Status: estimate of a different claim. It is not market capitalization, and it is not comparable with the $960 million or the $515 million until someone states how the debt claim is treated in those models.
Table 4. Results on the made-up date, and the claim each one refers to.
Scroll horizontally to view all columns.
| Result | Amount | Claim it refers to | Status |
|---|---|---|---|
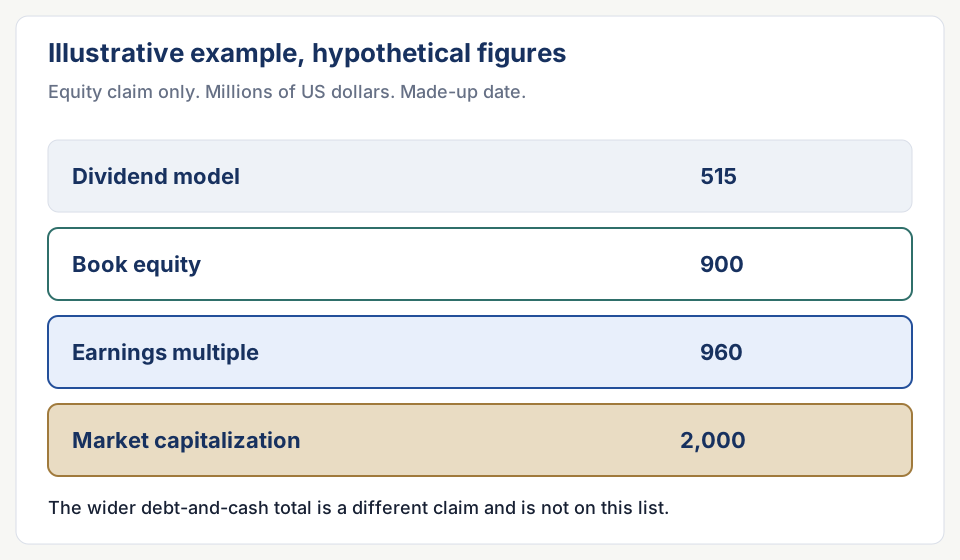
| Market capitalization | $2,000 million | Outstanding ordinary shares at the quoted price | Estimate from two disclosure-role inputs |
| Book equity | $900 million | Accounting residual | Disclosure-role amount |
| Earnings multiple | $960 million | Equity, if the ratio fits this profit | Estimate |
| Dividend model | $515 million | Equity, if growth and the required return hold | Estimate |
| Market capitalization plus borrowings minus cash | $2,300 million | Equity plus borrowings, cash removed | Estimate of a wider claim |
The equity-claim column runs from $515 million to $2,000 million on one made-up day. The spread is the record of the assumptions. It is not a trading signal, and it is not a forecast that the made-up price will move.
Spending plans are outside this arithmetic on purpose. The dividend model has no capital-expenditure line, so it cannot say whether the plants are being maintained or expanded. The notes on types of capital expenditure and on capital expenditure versus operating expense are the place to classify a spending figure before anyone drops it into a cash-flow model. The capital spending section sets out the wider questions about demand and replacement. Those pages do not supply the $30 million dividend used here.
What would move the example
Change the assumed ratio from 12 to 15 and the earnings estimate moves from $960 million to $1,200 million. The share price in the example does not change, because the price was entered as an observation. Change the required return from 9 percent to 8 percent, leave growth at 3 percent, and the dividend model becomes $30.9 million divided by 0.05, which is $618 million. A one-point change in an assumption moves the model by about $100 million in this setup. That is why the log stores the assumption next to the result.
The example has no net realisable value and no replacement cost. An assets-approach floor cannot be filled in. Writing “unknown” is the finished entry for those rows.
ACCA’s discussion of control is a further limit on the $2,000 million. A quoted share price is the price of the claim that trades, which for many listed companies is a minority position. A buyer who can direct the business is buying a different claim, and the article says that buyer should expect to pay a premium for control. This example does not estimate a premium. The object record would need a new row, “minority quote versus control,” before a control figure could be compared with market capitalization.
Industrial earnings also move with the cycle. A single year’s $80 million profit is a poor base for a multiple if that year is a peak or a trough. This page does not normalize the $80 million. It only labels it. Readers who need the cycle question can keep going in the valuation section once the notes on cyclical earnings are published, and they can use the markets section for how the industry itself is organized. Until then, the honest statement is that the example’s profit has no cycle adjustment.
Limitations and uncertainty
The four equity figures are illustrations of method, not a range an investor should treat as a valuation opinion. The terms and research disclaimer says the site’s material is for research. Nothing here is a bid, a fairness opinion, or a tax computation.
ACCA’s article is a student note. It is not an appraisal standard, and its 2011 supermarket ratios are trapped in that date. IFRS 13 is an accounting standard for fair value of assets and liabilities. Investor.gov’s glossary defines market capitalization and does not rank valuation models. The SEC guide explains what the primary statements report. None of those sources picked the ratio of 12, the 3 percent growth rate, or the 9 percent required return. Those three numbers exist only inside the example.
Real filings add problems this example leaves out. Share counts change when awards vest or when a company buys its own shares. “Profit after tax” may be a company-defined figure that does not match the earnings a published ratio used. Borrowings may exclude leases. Cash may be trapped in a subsidiary. Segment revenue can matter more than the consolidated total for an equipment maker that also sells parts and service. If the document does not split those items, the log should say so. The corrections page is how a published mistake on this site gets recorded once a source shows the sentence was wrong.
A model that prints $515 million to the dollar is not more precise than the growth rate it assumed. Keep the result at the same resolution as the weakest input, and keep the input’s status visible.
Questions that usually sit under the headline
What is the valuation of a company?
It is the estimate you get after you name the claim, the date, the perimeter and the purpose, and after you show which inputs were copied from a source and which were assumed. In the example, $2,000 million, $900 million, $960 million and $515 million are four answers to four versions of the question. Asking for “the” valuation, with those choices left blank, does not pick one of them.
How does a public-company example stay honest?
Mark every invented amount as hypothetical, which Table 3 does. Then show the arithmetic in words so a reader can repeat it. Then refuse to fill inputs the example does not contain. There is no asset-sale floor here, no control premium, and no split between maintenance and growth spending. A worked example that invents those missing pieces stops being a check on method.
Can the dividend model be used as a price target?
No. The $515 million is what the formula returns from a $30 million dividend, 3 percent growth and a 9 percent required return. The example’s own quoted equity value is $2,000 million. The gap records the assumptions. It does not say the made-up shares should trade at $5.15. A required return and a growth rate taken from a real filing would still be estimates, and they would still need the object record in Table 1.
Continue the research
Related Research
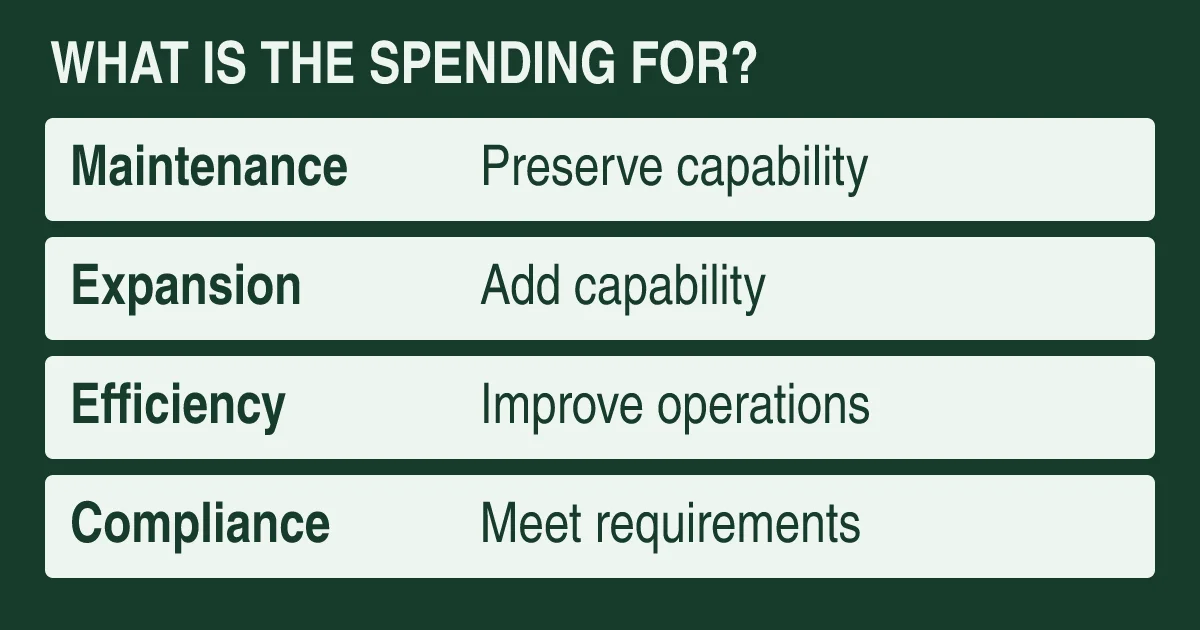
Types of CapEx: Maintenance and Growth
How can a reader identify what capital spending is intended to do without treating a management classification as a standard accounting disclosure?
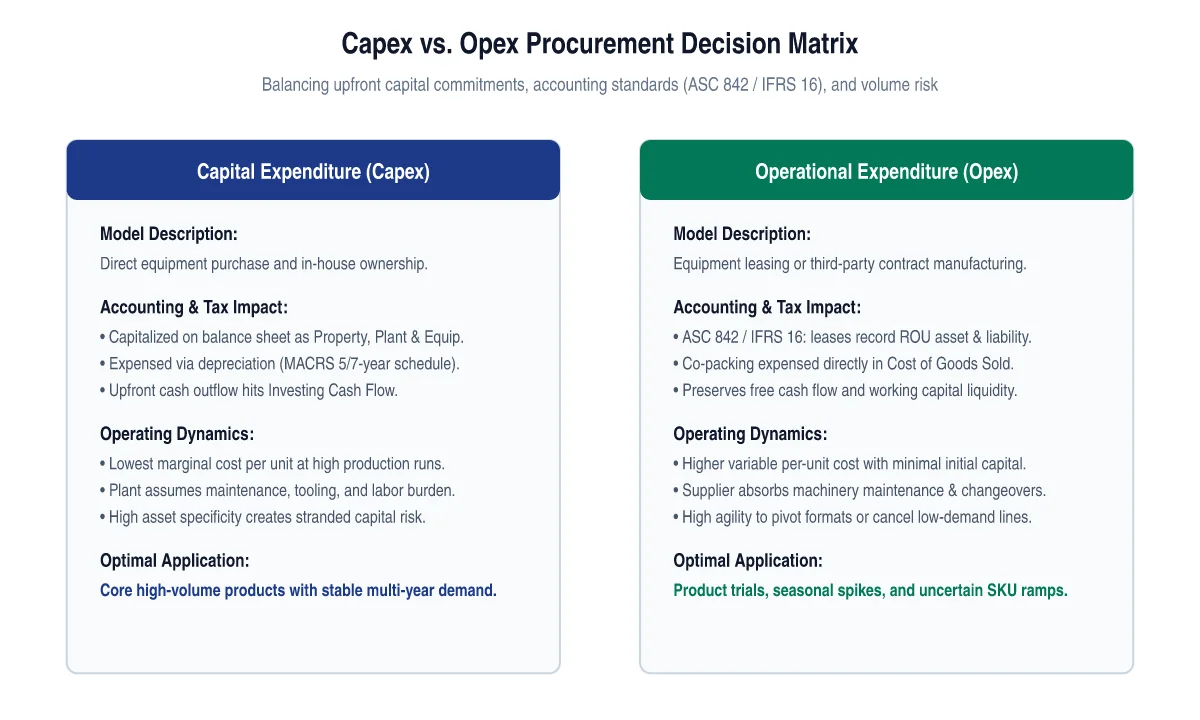
Capex vs Opex in Industrial Manufacturing and Machinery
How do industrial companies evaluate the trade-off between capital expenditure and operational expenditure when acquiring packaging and production capacity?
Sources & Data Notes
-
Student technical article on share valuation. Its supermarket illustration is dated 24 December 2011 and is not reused here.
-
Accounting measurement of an asset or a liability. Not a template for valuing a company's equity.
-
Used for the role of the balance sheet, the income statement and the cash flow statement.