
Company valuation multiples: pair the claim with the measure

Key Takeaways
- A company valuation multiple divides a market price by a measure of size, and the price and the measure have to refer to the same claim.
- Revenue multiples remain computable when earnings are negative or too small to use, and they still need an equity numerator or an enterprise numerator.
- Damodaran's US enterprise-value file dated January 2026 prints two samples, positive EBITDA and all firms, so a loss-making filter changes the figure.
- Copy the region, the year, the industry name and the sample. This page does not rank industries.
Research Scope
- Regions
- Damodaran enterprise-value multiples: United States sector file, data as of January 2026. The arithmetic example has no country and no issuer.
- Period
- Pages read on 12 October 2026. Multiples page: data as of January 2026. Current-data index: last full update 9 January 2026.
- Industries
- Resource and industrial research setting. The worked dataset row is the Machinery line. A biotechnology line shows the sample gap only.
- Data objects
- Equity and enterprise numerators; earnings, book equity, revenue, EBITDA, EBIT, EBIT (1-t) and EBITDAR&D; positive-EBITDA and all-firms columns.
A company valuation multiple is a market price divided by a measure of size. The price and the measure have to refer to the same claim. Market capitalization over profit after tax describes the shares. Enterprise value over operating profit describes the firm, debt included. A figure that mixes those two claims belongs to neither one.
What a company valuation has to name fixes the claim, the date and the input log before any ratio is chosen. This page is the next record: which ratio, and which region, year, industry name and loss-making sample the industry figure came from. It is a research method. It does not value a named issuer, and it does not say what anyone should buy or sell.
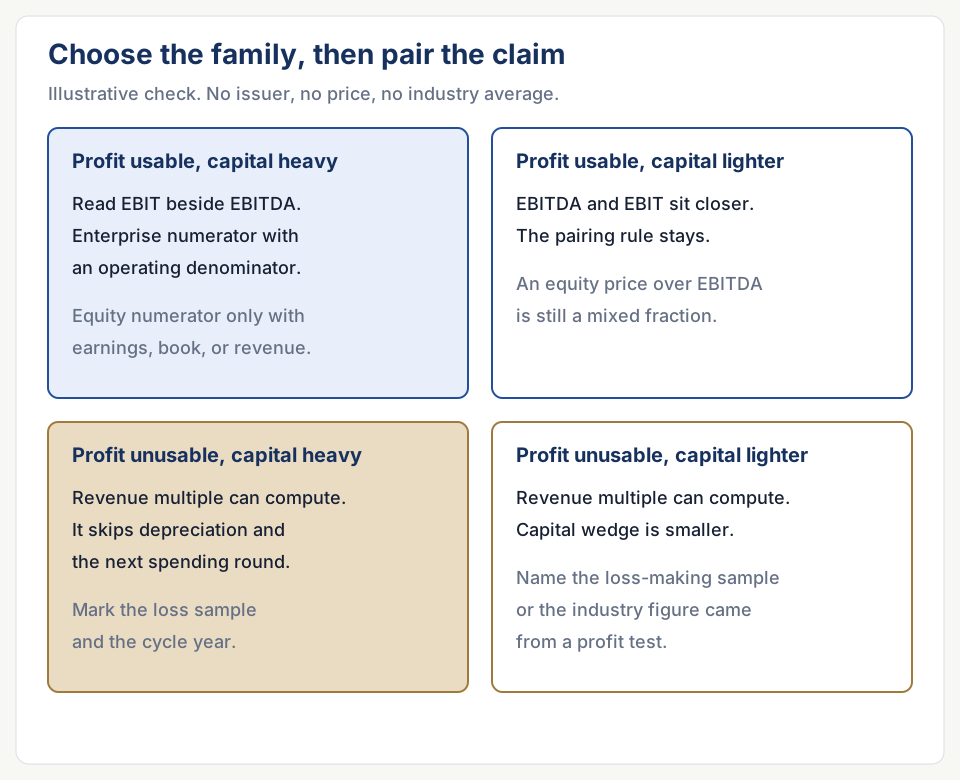
Profit usable, capital heavy. The operating-profit columns can be computed. Read the EBIT column next to the EBITDA column, because a heavy capital stock drives a wedge between them. Use an equity numerator only with an equity denominator: earnings to shareholders, book equity, or revenue paired with the equity price on purpose.
Profit usable, capital lighter. EBITDA and EBIT sit closer, because depreciation is a smaller share of the denominator. The pairing rule is unchanged. An equity price over EBITDA is still a mixed fraction.
Profit unusable, capital heavy. Earnings and EBIT multiples break or become unstable. A revenue multiple can still be computed, on an equity numerator or an enterprise numerator, and it still skips depreciation and the next round of spending. Record that any “positive EBITDA” industry sample has set firms like this one aside. Record the cycle year as well. Resource earnings and industrial orders both move with the cycle, and a peak year in the denominator capitalizes the peak.
Profit unusable, capital lighter. A revenue multiple can still be computed. The capital wedge is smaller. The loss-making sample still has to be named, or the industry figure came from firms that cleared a profit test this firm did not clear.
Match the numerator to the denominator
Damodaran’s introduction splits discounted cash flow into two jobs. Firm valuation uses cash flow before debt payments, which he calls free cash flow to the firm, and discounts it at the cost of capital. Equity valuation uses cash flow after debt payments, free cash flow to equity, and discounts it at the cost of equity. He also writes that equity value follows from firm value once every non-equity claim is removed, when the two routes are done consistently. That split is the reason a multiple has a pairing rule. The top of the fraction and the bottom have to price the same claim.
In the relative-valuation section of the same introduction, a market price is standardized by a common variable so that share count stops dominating the comparison. He names three standardizers for stocks: earnings, book value and revenue. He also notes that two standardizers can produce two values for one company. The practical meaning of “comparable,” in that section, is usually other companies in the same business. The valuation meaning he states first is similar cash flows, similar risk and similar growth. Those are different filters, and the multiple changes when the filter changes.
Table 1. Numerator-denominator pairing. Source: SRP Blog synthesis of Damodaran’s firm-versus-equity split and his list of standardizers (earnings, book value, revenue), plus the column names on his January 2026 US enterprise-value page. The enterprise numerator in a filing still has to be defined; this table does not supply that formula.
Scroll horizontally to view all columns.
| Multiple | Numerator | Denominator | Usable when | Pairing fault |
|---|---|---|---|---|
| Price / earnings | Equity price or market capitalization | Profit attributable to equity | That profit is positive, and it is the profit the ratio was built on | An enterprise numerator, or EBITDA treated as profit to shareholders |
| Price / book | Equity price or market capitalization | Book equity | Book equity is positive | An enterprise-value figure in the numerator |
| Price / revenue | Equity price or market capitalization | Revenue of the firm | Revenue is reported | Reading it as if borrowings were inside the price |
| Enterprise value / revenue | Enterprise value, as defined in the note | Revenue of the firm | Revenue is reported and the enterprise numerator is defined | Market capitalization standing in for enterprise value |
| Enterprise value / EBITDA | Enterprise value | EBITDA, as the dataset or the filing defines it | The chosen sample reports a number | An equity price over EBITDA |
| Enterprise value / EBIT | Enterprise value | EBIT | The chosen sample reports a number | Treating EBIT as cash flow after reinvestment |
| Enterprise value / EBIT (1-t) | Enterprise value | After-tax EBIT, following that column label | The page or the filing shows the cell | Treating the tax factor as the cash tax on one return |
| Enterprise value / EBITDAR&D | Enterprise value | EBITDA with research and development added back, as labeled | The dataset prints the cell | Comparing it with a plain EBITDA multiple |
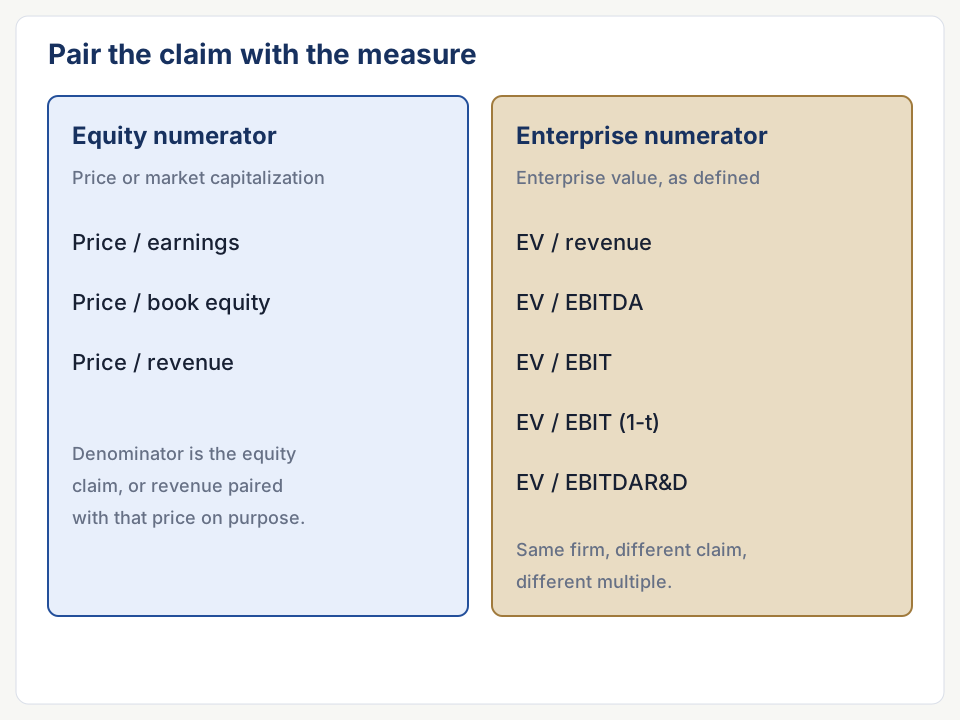
EBITDA adjustments inside a company’s own earnings release are a separate reading. This page stops at the pairing and at the sample the published column used.
The same made-up equipment maker, with the fraction written out
Illustrative example (hypothetical figures, not company data). The valuation object note already invented one listed equipment maker: market capitalization $2,000 million, interest-bearing borrowings $400 million, cash $100 million, profit after tax $80 million. This page keeps those four amounts and adds two more that the earlier page did not contain: revenue of $1,000 million and EBITDA of $200 million. Both new amounts are invented. No filing was opened for them.
The wider numerator used here is the one that earlier page already computed: $2,000 million plus $400 million minus $100 million, which is $2,300 million. Damodaran’s introduction reaches equity from firm value by removing non-equity claims. He does not, in the introduction, print this cash subtraction as the definition of the enterprise-value cells on the data page. The $2,300 million figure is the numerator this example is willing to show its work for.
The arithmetic:
Price / earnings is $2,000 million divided by $80 million, which is 25. That is the quoted equity claim divided by the made-up profit. The earlier page also used an assumed ratio of 12 on the same profit and got an equity estimate of $960 million. Twenty-five and twelve can both sit in the log. Twenty-five comes from the made-up price. Twelve was an assumption.
Price / revenue is $2,000 million divided by $1,000 million, which is 2.0. Enterprise value / revenue, using the $2,300 million numerator, is 2.3. Enterprise value / EBITDA is $2,300 million divided by $200 million, which is 11.5.
Source note for 25, 2.0, 2.3 and 11.5: invented arithmetic on the inputs in this section. They are not on Damodaran’s industry page, and they are not a filing.
The four results are four fractions. A reader who compares 25 with 11.5 without saying which claim each one uses is comparing an equity multiple with a firm multiple. The valuation section asks for the claim before the model. The terms and research disclaimer keeps the whole exercise inside research.
Revenue is the denominator that can survive a loss
Company valuation by revenue, and company valuation based on revenue, come up when the earnings line cannot carry a ratio. Profit after tax can be negative. EBIT can be a small number that makes the multiple lurch from one year to the next. Revenue can still be a positive reported total. Damodaran lists revenue beside earnings and book value as a way to standardize a market price, so the revenue form is one of the three he names.
The margin then sits inside the multiple, because it is no longer in the denominator. Two firms with the same revenue and different margins will not deserve the same revenue multiple if the thing being compared is profit. A revenue multiple hides that difference until someone writes the margin down beside it.
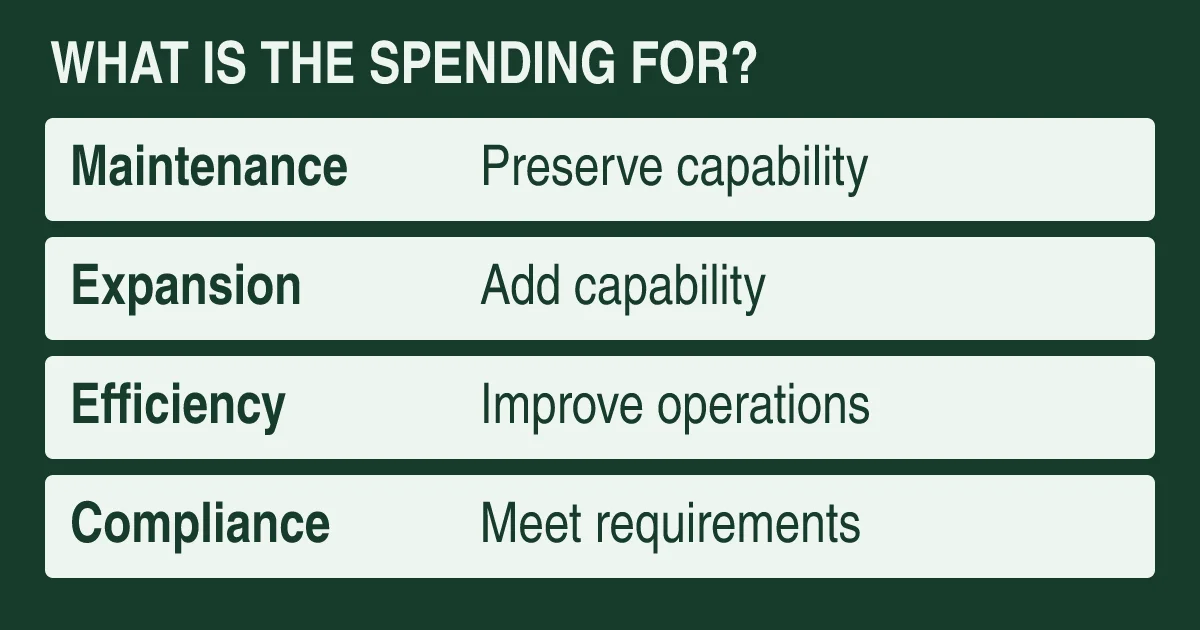
Capital intensity makes the hide larger. A mine, a producing well, or a plant full of long-lived machines can report revenue in a year when depreciation is heavy and the next equipment campaign is still ahead. A revenue multiple does not record that spending. Types of capital expenditure is the place to separate maintenance, expansion, efficiency and compliance before a spending figure is treated as optional. Capital expenditure versus operating expense is the place to see whether the outlay was capitalized. Those pages classify spending. They do not supply a revenue multiple.
The January 2026 US enterprise-value page used below prints operating-income columns. It has no revenue-multiple column, so this note quotes no industry revenue multiple from that file. Figure 1 already sorts the revenue case by capital intensity.
One US file, two samples, and a single row to read
Company valuation multiples by industry differ for the reason Damodaran gives for comparables: businesses differ in cash flow, risk and growth, and the set called “the industry” is a choice. His peer-average variation uses an illustration in which a stock at 12 times earnings is set against a sector average of 15, on the assumption that the average stands for a typical company. In the limitations section he adds that a comparison with the group still carries whatever overvaluation or undervaluation is already in the group. The 12 and the 15 are his illustration, located in “Variations on Relative Valuation.” They are not a screen this page applies to any security.
The checkable file for enterprise-value multiples is his US sector page, Enterprise Value Multiples by Sector (US). The heading names the United States. The date line says the data used are as of January 2026. The data-used line says “Multiple data services.” The spreadsheet HTML of the same table is vebitda.htm. That export does not repeat the date line. On 12 October 2026 the rows cited here matched across the two URLs.
His current-data index states a last full update of January 9, 2026. The opening paragraph says the datasets, with a couple of exceptions, are refreshed once a year in the first two weeks, and that the statistics then use the latest figures he can find, which at the start of the year means trailing 12-month data through the third quarter of the prior year. That sentence lives on the index. The multiples table does not reprint it. A reader who needs the vintage writes both: January 2026 on the multiples page, and January 9, 2026 on the index, and keeps the trailing-twelve-month sentence attached to the index.
The table has one firm-count column, then four columns under “Only positive EBITDA firms,” then four under “All firms.” The firm-count column sits outside both groups. The page does not print a separate count of firms with negative EBITDA. Copying one EV/EBITDA cell without naming the group mixes the two samples.
The Machinery row on that US page reports 105 firms, an EV/EBITDA of 16.22 for positive-EBITDA firms, and an EV/EBITDA of 17.46 for all firms. In the positive-EBITDA group the same row shows EV/EBIT of 21.04. Source note: Damodaran, Enterprise Value Multiples by Sector (US), data as of January 2026, Machinery row, read 12 October 2026 at the HTML page above. The gap from 16.22 to 21.04 is the gap between two denominators on one row. It is the capital-intensity point in number form, for this industry label, this region and this date. It is not a normal level for every machinery company, and it is not a target.
The loss-making sample shows up more sharply on Drugs (Biotechnology). That row reports 496 firms, an EV/EBITDA of 15.78 in the positive-EBITDA group, and an EV/EBITDA of 51.49 in the all-firms group. Source note: same page, same date, Drugs (Biotechnology) row. The page does not say how many of the 496 have negative EBITDA. What it does show is that the column choice moves the published figure. This note uses the row as a sample warning. It is not a view on biotechnology businesses.
Bank (Money Center) reports 15 firms and NA in the multiple cells. Source note: same page, same date, that row. NA is an empty answer. It is not zero.
Metals, oil and gas, packaging and the other industry names are on that same US page. Each one has its own firm count and its own pair of samples. Copy the row you are actually using, including the industry name as printed. Assembling those rows here would be an industry ranking, and this page does not make one. A global workbook, if you open one from the data index, is a different region. The checklist below has a region field because of that.
Cycle position is the field the industry page will not fill in for you. A January 2026 multiple applied to a single peak or trough year in a resource business capitalizes that year. The markets section is where the industry’s own structure is described. The multiple file does not say whether the trailing year behind a given firm was mid-cycle. Write “unstated” when you do not know.
Write the sample down before you reuse the figure
Table 2. Comparability checklist. The right-hand column is filled only for the Machinery row cited above, so a completed record has a shape. Source: SRP Blog checklist. The Machinery cells are from Damodaran’s US page, data as of January 2026, read 12 October 2026.
Scroll horizontally to view all columns.
| Field | What to write | Machinery row, as a completed example |
|---|---|---|
| Region | The file’s universe, in its own words | United States (heading: Enterprise Value Multiples by Sector (US)) |
| Year | The date the page states, plus the index date if you use the timing note | Data as of January 2026. Index last full update: January 9, 2026 |
| Industry | The industry name as printed, not a homemade group | Machinery |
| Loss-making sample | Which column group | Say which: positive EBITDA, or all firms. Both exist on the row |
| Firm count | The number in the firm-count cell | 105. The page does not split that count by sign of EBITDA |
| Numerator | Equity or enterprise, and the definition you used | Enterprise value, as the page’s column. The page does not print the algebra |
| Denominator | The column name | EV/EBITDA is 16.22 (positive EBITDA) or 17.46 (all firms). EV/EBIT in the positive group is 21.04 |
| Cycle year you apply it to | Peak, trough, or unstated | Unstated on the source page. Fill it from the filing you are reading |
| Empty cells | Leave NA as NA | Not used on this row. On Bank (Money Center), the multiple cells are NA |
| Comparison type | One firm, a peer average, or a regression, matching Damodaran’s three variations | A sector row is a peer-group aggregate, not one firm’s filing |
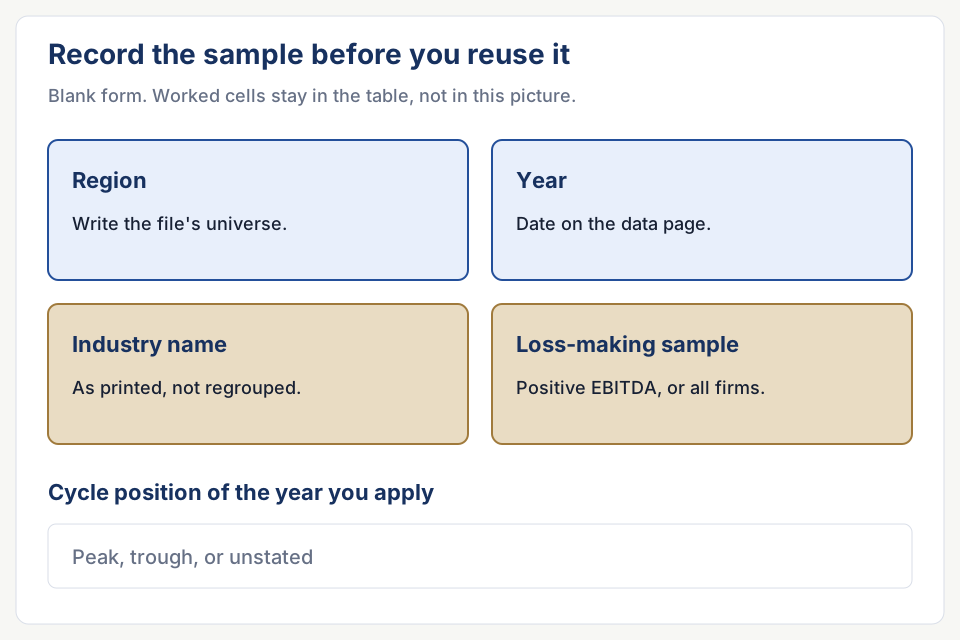
A completed checklist for any other industry is the same form with that industry’s cells copied from the file. The data sources directory is where this site points readers who need the filing search once the multiple is only a comparison, not a substitute for the statements. The editorial policy asks for the source and the limit to stay visible.
Limitations and uncertainty
The 25, 2.0, 2.3 and 11.5 figures exist only inside the made-up equipment example. Changing the invented EBITDA changes 11.5. Changing the invented revenue changes 2.0 and 2.3. They will not be updated when a real company files, because no company filed them.
The Machinery and biotechnology cells are Damodaran’s aggregates for a US industry label, data as of January 2026, with the sample group named beside each cell. They are not a median of a hand-picked peer set, and they are not a forecast. His introduction’s limit still applies: a multiple taken from a group carries the pricing of that group. A stock that sits below the group can sit inside a group that is itself high or low against a wider standard. This page does not make that second comparison.
The firm-count column is not a count of positive-EBITDA firms. Using 105 as if it were the number of profitable machinery firms overclaims the table. The trailing-twelve-month sentence is the index’s general timing note, exceptions included, and it is not a line on the Machinery row.
Banks are on the page with NA in the multiple cells. Forcing an EV/EBITDA onto a bank row because the machinery row has one is a pairing error and a sample error at once.
Nothing here is a bid, a price target, or a view on a security. Relative valuation, as Damodaran describes it, compares an asset with the prices of the assets you chose. The choice of region, year, industry name and loss-making sample is the comparison. Leave any one of them blank and the multiple is not ready to reuse.
Questions under the heading
What are the common company valuation multiples?
Price over earnings, price over book equity, and price over revenue use an equity numerator. Enterprise value over revenue, EBITDA, EBIT, EBIT (1-t) and EBITDAR&D use an enterprise numerator. Table 1 pairs each one. The common fault is an equity price over an operating-profit measure that still belongs to the whole firm.
When does company valuation based on revenue still compute?
When the earnings or EBIT denominator is negative, missing, or too small to trust, and when you have said so. Revenue can remain positive. You still choose an equity numerator or an enterprise numerator, and you still write the margin and the capital spending beside the result. The US enterprise-value file cited here has no revenue-multiple column, so an industry revenue multiple has to come from a file that actually prints one.
Why do company valuation multiples by industry differ?
The businesses differ in cash flow, risk and growth, which is Damodaran’s own account of why a comparable set matters. On one date and in one region, the US page still prints a different figure for each industry name, and a second figure once the all-firms column replaces the positive-EBITDA column. Machinery at 16.22 and 17.46, and biotechnology at 15.78 and 51.49, are two readings of that column choice. They are not a ranking.
Continue the research
Related Research

What is the valuation of a company?
What has to be written down before a company valuation figure can be compared with another figure?
Types of CapEx: Maintenance and Growth
How can a reader identify what capital spending is intended to do without treating a management classification as a standard accounting disclosure?
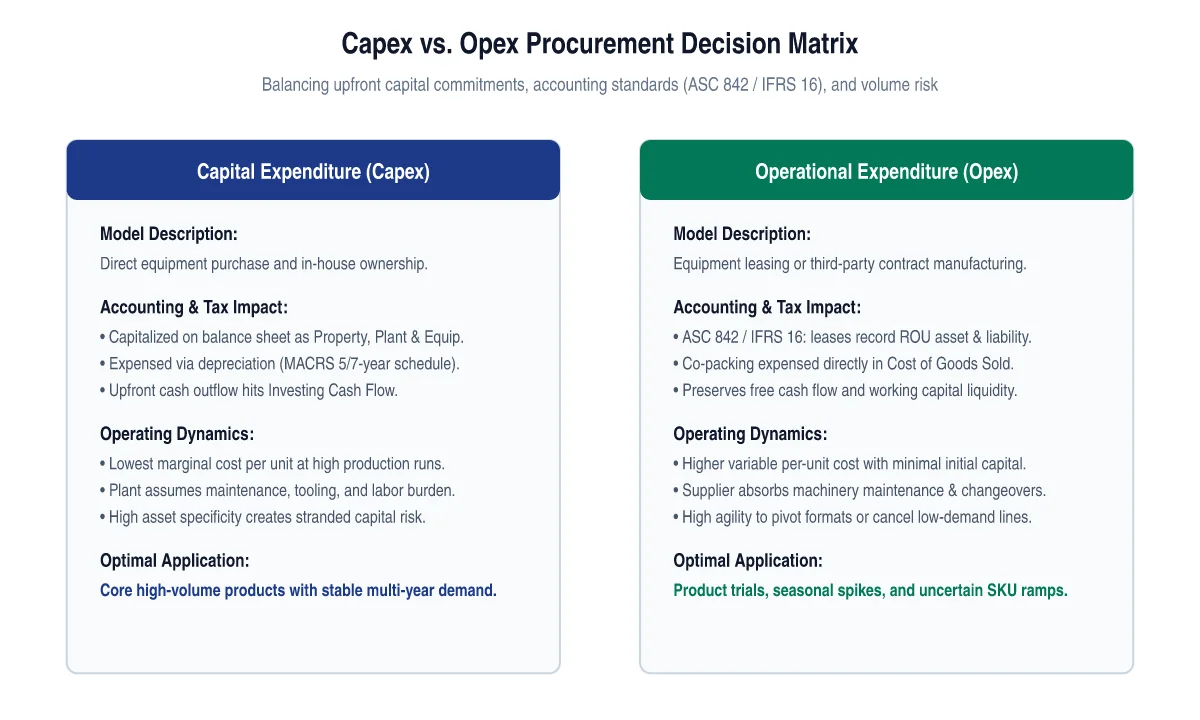
Capex vs Opex in Industrial Manufacturing and Machinery
How do industrial companies evaluate the trade-off between capital expenditure and operational expenditure when acquiring packaging and production capacity?
Sources & Data Notes
-
Used for the firm-versus-equity split, for standardizing price by earnings, book value or revenue, and for the limit that a peer comparison carries the group's pricing.
-
Date of analysis line reads: Data used is as of January 2026. Data used line reads: Multiple data services. Universe label in the heading: US.
-
Spreadsheet HTML of the table. It does not repeat the January 2026 date line. Cell values checked against vebitda.html on 12 October 2026 matched for the rows cited here.
-
Last full update stated as January 9, 2026. The timing paragraph is about the datasets in general, with a couple of exceptions, and is not reprinted on the multiples table.