
CapEx to-revenue ratio by industry: comparing capital intensity
Key Takeaways
- A CapEx-to-revenue ratio only supports comparison when both numerator and denominator share the same fiscal period, currency, accounting perimeter and gross-versus-net definition.
- In NYU Stern's January 2026 U.S. dataset (4,822 nonfinancial firms), cumulated Net CapEx/Sales is 4.29% and Sales/Invested Capital is 1.43, ranging from 43.72% Net CapEx/Sales in water utilities to negative net figures where depreciation exceeds gross additions.
- Census ACES data transitioned into the Annual Integrated Economic Survey (AIES) in March 2024 and covers domestic non-farm establishments by NAICS, so it cannot be divided by a global issuer's 10-K revenue.
Research Scope
- Regions
- United States sector statistics and SEC Form 10-K disclosures; general analytical workflow.
- Period
- NYU Stern U.S. sector dataset dated January 2026; Census ACES/AIES documentation accessed October 17, 2026.
- Industries
- Utilities, oil and gas, railroads, steel, packaging, machinery, food processing and asset-light service comparisons.
- Data objects
- Gross capital expenditures, net capital expenditures, depreciation, revenue, invested capital and survey perimeter rules.
Comparing a utility’s capital spending ratio directly against a machinery maker’s or a software vendor’s without checking the numerator will misclassify reinvestment needs. A company or industry comparison requires matching the CapEx formula, the accounting perimeter and the asset base before reading any percentage.
To compare the CapEx to-revenue ratio by industry, first verify whether the source reports gross capital expenditures divided by revenue or net capital expenditures (after deducting depreciation) divided by sales, and whether sector figures are cumulated dollar totals or simple firm averages. In NYU Stern’s January 2026 U.S. dataset across 4,822 nonfinancial listed firms, cumulated Net CapEx to sales is 4.29% and Sales to invested capital is 1.43, spanning from 43.72% Net CapEx to sales in water utilities (Sales to invested capital of 0.24) to 4.14% in machinery (Sales to invested capital of 1.95). Place these comparisons inside the wider capital spending research guide before moving to company filings.
Scroll horizontally to view all columns.
| Metric or input | Formula and typical source | What it tells the researcher |
|---|---|---|
| Gross CapEx to revenue | Cash additions to PP&E ÷ Total revenue (SEC Form 10-K Item 8 cash flow and income statements) | Share of current-period revenue committed to gross physical asset additions |
| Net CapEx to sales | (Capital expenditures - Depreciation and amortization) ÷ Sales (NYU Stern sector tables) | Net reinvestment in fixed assets above or below current depreciation charges |
| CapEx to depreciation | Gross capital expenditures ÷ Depreciation and amortization (10-K Item 8 or sector dataset) | Whether gross additions exceed (>100%) or trail (<100%) historical depreciation |
| Sales to invested capital | Trailing 12-month sales ÷ (Book debt + Book equity - Cash) (NYU Stern sector tables) | Revenue generated per dollar of invested capital; lower values indicate heavier asset bases |
| Net PP&E to revenue | Ending or average net property, plant and equipment ÷ Total revenue (10-K Item 8 balance sheet) | Balance-sheet fixed-asset intensity required to support annual sales |
| Survey capital spending total | Domestic structures and equipment outlays by NAICS (U.S. Census Bureau ACES archive / AIES) | National domestic capital formation by industry; requires a matched survey denominator for ratios |
How do the CapEx formula and capital intensity metrics differ?
Capital intensity can be measured either as an annual cash flow relative to sales (CapEx to revenue) or as an installed balance-sheet stock relative to sales (PP&E to revenue or Sales to invested capital). Using one without the other can confuse a temporary construction pause in a heavy industry with an asset-light business model.
When reading a U.S. public company’s annual report on SEC Form 10-K, the cash-flow and balance-sheet inputs sit in Part II, Item 8 (Financial Statements and Supplementary Data), while forward commitments and liquidity discussion appear in Part II, Item 7 (MD&A). The SEC’s guide to financial statements explains that cash outflows to buy property, plant and equipment appear under investing activities on the statement of cash flows, whereas depreciation allocates historical cost on the income statement.
Researchers encounter three distinct formulas labeled as a “CapEx formula” or capital intensity ratio:
- Direct cash-flow CapEx formula (preferred for issuer filings): Extract cash paid for additions to property, plant and equipment directly from the investing section of the consolidated statement of cash flows. Exclude business acquisitions and deduct any government grants or noncontrolling-interest contributions only if you record the exact company reconciliation, as illustrated in our oil company profits and capex guide.
- Accrual balance-sheet approximation: Textbooks often write
CapEx = Ending Net PP&E - Beginning Net PP&E + Depreciation. In real company filings, that shortcut sweeps in property acquired through mergers, asset write-downs, disposals, foreign-currency translation and newly recognized lease assets. Use the cash-flow statement line first, and read the PP&E footnote to explain balance-sheet changes. - Net CapEx and Invested Capital turnover (sector datasets): In Aswath Damodaran’s variable definitions at NYU Stern,
Capital Expendituresis the cumulated cash-flow capital spending for the sector (generally excluding acquisitions),Net Capital Expendituresis defined as capital expenditures minus depreciation, andInvested Capitalis book value of debt plus book value of equity minus cash.
Pairing a flow ratio (Gross CapEx ÷ Revenue or Net CapEx ÷ Sales) with a stock ratio (Sales ÷ Invested Capital or Net PP&E ÷ Revenue) separates two different questions: how much capital the business requires to exist at all, and how fast it is adding assets in the current year.
How does the CapEx to-revenue ratio vary by industry in U.S. data?
Across U.S. listed companies, heavy infrastructure, utilities, extractive energy and rail transport tie up several dollars of invested capital per dollar of sales and spend heavily on physical plant, whereas machinery assembly, packaging and commercial services turn invested capital faster and require smaller net additions per revenue dollar.
The table below extracts selected industrial, resource, utility and service sectors from NYU Stern’s Capital Expenditures by Sector (US) dataset, dated January 2026. Every ratio in this source is computed from cumulated sector totals (summing the numerator across all listed firms in the sector and dividing by the summed denominator), not as an unweighted average of individual firms.
Scroll horizontally to view all columns.
| Sector (NYU Stern US classification, Jan 2026) | Number of firms | Capital expenditures (US $M) | Depreciation and amort (US $M) | CapEx / Deprecn | Net CapEx / Sales | Sales / Invested capital (LTM) |
|---|---|---|---|---|---|---|
| Utility (Water) | 14 | $5,829.11 | $1,649.96 | 353.29% | 43.72% | 0.24 |
| Utility (General) | 14 | $57,087.70 | $18,120.50 | 315.04% | 33.58% | 0.30 |
| Power | 46 | $151,788.45 | $58,259.86 | 260.54% | 24.35% | 0.37 |
| Oil/Gas (Production and Exploration) | 142 | $92,434.62 | $58,916.51 | 156.89% | 19.05% | 0.57 |
| Transportation (Railroads) | 4 | $9,170.10 | $5,640.10 | 162.59% | 6.47% | 0.46 |
| Steel | 19 | $7,060.38 | $3,895.43 | 181.25% | 5.69% | 1.80 |
| Packaging & Container | 19 | $6,085.20 | $6,773.45 | 89.84% | 5.14% | 1.84 |
| Engineering/Construction | 48 | $3,728.95 | $2,999.65 | 124.31% | 4.85% | 4.36 |
| Machinery | 105 | $4,700.86 | $6,927.64 | 67.86% | 4.14% | 1.95 |
| Food Processing | 78 | $9,522.72 | $7,087.87 | 134.35% | 2.29% | 1.71 |
| Oil/Gas (Integrated) | 4 | $52,222.10 | $51,102.80 | 102.19% | 0.39% | 1.02 |
| Advertising | 52 | $705.57 | $1,885.26 | 37.43% | -1.52% | 3.85 |
| Total Market (without financials) | 4,822 | $1,446,178.46 | $999,135.44 | 144.74% | 4.29% | 1.43 |
| Total Market | 5,994 | $1,493,022.38 | $1,004,904.99 | 148.57% | 4.23% | 0.82 |
Three structural patterns stand out when you read the columns together rather than looking at Net CapEx / Sales in isolation:
- Gross spending versus net spending after depreciation: In
Oil/Gas (Integrated), four large companies spent $52,222.10 million in gross capital expenditures, yetNet CapEx / Salesis only 0.39% because depreciation and amortization ($51,102.80 million) nearly matched gross additions (CapEx / Deprecnof 102.19%). Treating 0.39% as a “low-capex industry” would confuse net expansion above depreciation with total capital required to maintain production. - Why Net CapEx / Sales can be negative while gross CapEx is positive:
Advertisingspent $705.57 million on capital expenditures, but itsDepreciation & Amortwas $1,885.26 million (CapEx / Deprecnof 37.43%), yielding-1.52%inNet CapEx / Sales. Conversely, where Damodaran’s full reinvestment table incorporates net R&D or acquisition adjustments,Net CapEx / Salescan stay positive even whenCapEx / Deprecnis below 100% (as seen inPackaging & Containerat 89.84% andMachineryat 67.86%). Always check whether a database reports gross PP&E additions or net reinvestment. - Flow intensity versus balance-sheet turnover:
Transportation (Railroads)has a moderateNet CapEx / Salesof 6.47%, not far fromSteel(5.69%) orPackaging & Container(5.14%). Yet railroads generate only0.46inSales / Invested Capital (LTM), compared with1.80in steel and1.84in packaging, because track networks and rolling stock sit on the balance sheet for decades.

What is a good CapEx ratio, and why does no single benchmark work?
There is no universal “good” CapEx-to-revenue ratio across industries; a defensible ratio is one that covers the sector’s physical replacement requirements while earning a return above the cost of capital on any expansion spending.
Rules of thumb that label any CapEx-to-revenue ratio below 5% or 10% as “efficient” fail as soon as you cross sector boundaries or project phases:
- Physical asset structure sets the baseline: A water or electric utility (
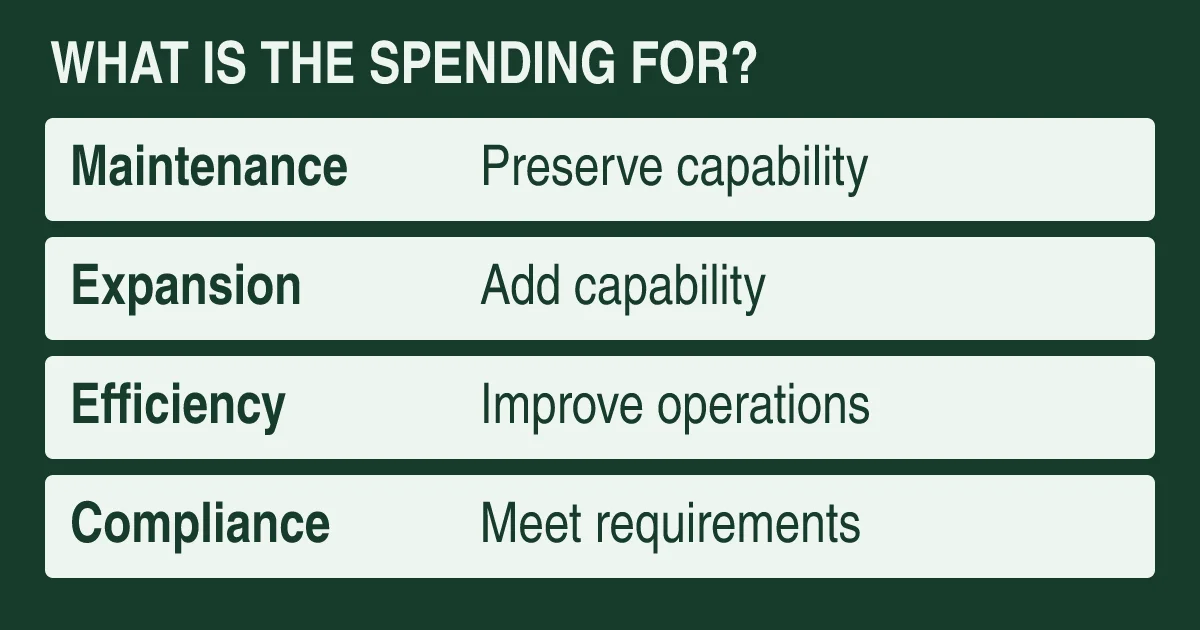
Sales / Invested Capitalof 0.24 to 0.37 in the January 2026 U.S. table) must fund treatment plants, substations and distribution lines upfront and recover them over multi-decade regulatory lives. An engineering contractor (Sales / Invested Capitalof 4.36) bills labor and project execution on customer sites and needs far less owned plant per dollar of revenue. - Maintenance versus expansion stage: As explained in types of CapEx: maintenance and growth, two companies in the same industry can report very different ratios in a single year because one is building a new plant while the other is running an existing line. A low ratio during a multiyear deferral of maintenance can precede a catch-up spending spike rather than signal durable efficiency.
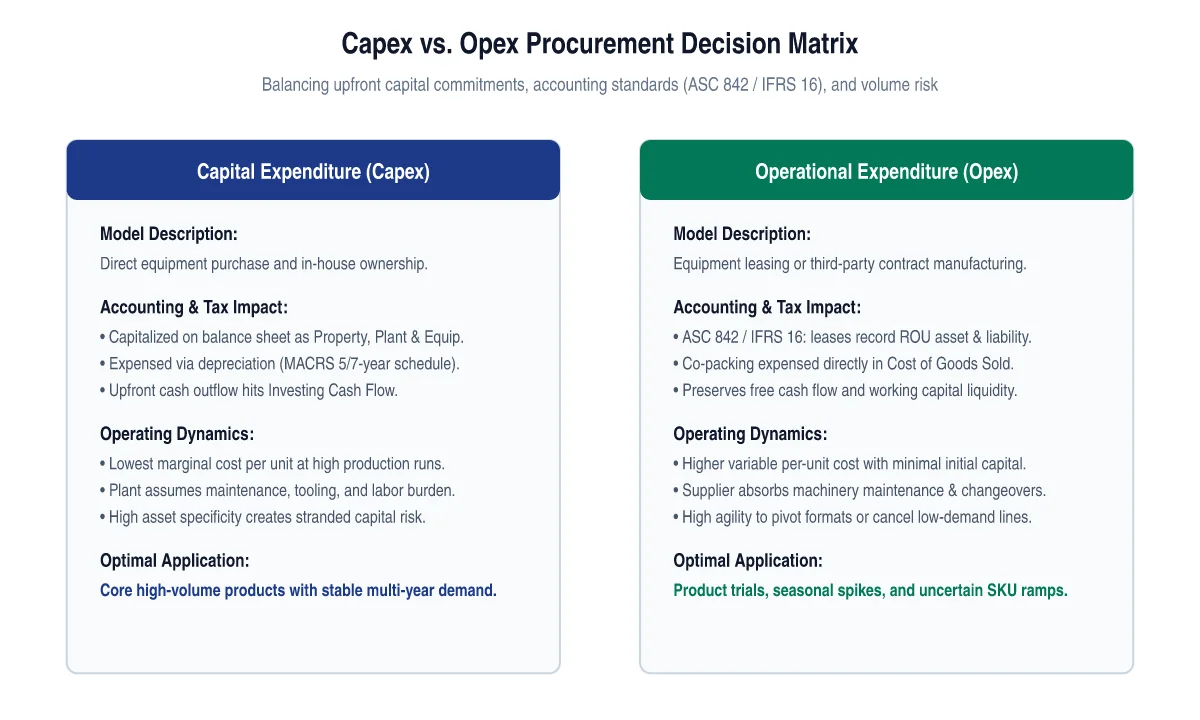
- Own-versus-lease and outsourcing choices: Under CapEx vs OpEx in manufacturing, a company that uses contract packaging or operating leases shifts cash outflows out of the PP&E additions line on the cash-flow statement. Its gross CapEx-to-revenue ratio will look lower than a vertically integrated peer’s even if both run the same packaging machinery on the shop floor.
- Denominator volatility in cyclical industries: In mining, steel and oil production, revenue swings with realized commodity prices while committed project spending moves on multiyear engineering schedules. When commodity prices drop,
CapEx ÷ Revenuerises mechanically even if management cuts the dollar capital budget. This is why EBITDA valuation in capital-intensive sectors and valuation multiples require multiyear cycle checks rather than single-year snapshots.
Why do aggregate sector ratios and company averages diverge?
An industry’s cumulated ratio (Σ CapEx ÷ Σ Revenue) weights each company by its dollar denominator, whereas a simple average of company ratios weights a $200 million regional supplier equally with a $20 billion producer.
Damodaran’s variable guide notes that sector ratios are calculated by summing the numerator across all firms in the sector and dividing by the summed denominator. The hypothetical two-company example below shows how the same underlying numbers produce different benchmarks depending on the aggregation method and gross-versus-net definition.
Illustrative example only (hypothetical figures for two industrial companies in the same fiscal year and currency, not real company disclosures):
Scroll horizontally to view all columns.
| Measure | Hypothetical Company A (large mature producer) | Hypothetical Company B (mid-size expanding supplier) | Sector cumulated total (A + B) | Simple unweighted average of A and B |
|---|---|---|---|---|
| Annual revenue | USD 10,000 million | USD 1,000 million | USD 11,000 million | Not applicable |
| Gross CapEx (cash additions to PP&E) | USD 500 million | USD 220 million | USD 720 million | Not applicable |
| Depreciation and amortization | USD 480 million | USD 70 million | USD 550 million | Not applicable |
| Net CapEx (Gross CapEx - Depreciation) | USD 20 million | USD 150 million | USD 170 million | Not applicable |
| Ending net PP&E | USD 6,000 million | USD 650 million | USD 6,650 million | Not applicable |
| Gross CapEx / Revenue | 5.00% (500 ÷ 10,000) | 22.00% (220 ÷ 1,000) | 6.55% (720 ÷ 11,000) | 13.50% ((5.00% + 22.00%) ÷ 2) |
| Net CapEx / Revenue | 0.20% (20 ÷ 10,000) | 15.00% (150 ÷ 1,000) | 1.55% (170 ÷ 11,000) | 7.60% ((0.20% + 15.00%) ÷ 2) |
| CapEx / Depreciation | 104.17% (500 ÷ 480) | 314.29% (220 ÷ 70) | 130.91% (720 ÷ 550) | 209.23% ((104.17% + 314.29%) ÷ 2) |
| Net PP&E / Revenue | 60.00% (6,000 ÷ 10,000) | 65.00% (650 ÷ 1,000) | 60.45% (6,650 ÷ 11,000) | 62.50% ((60.00% + 65.00%) ÷ 2) |
In this hypothetical pair, both companies have nearly identical balance-sheet asset intensity (Net PP&E / Revenue of 60.00% and 65.00%). Yet Company B’s expansion project pushes its single-year Gross CapEx / Revenue to 22.00%. Because Company A is ten times larger by revenue, the cumulated sector gross ratio is 6.55%, while the simple average of the two firms is 13.50%, and the cumulated net ratio is 1.55%. Before citing an “industry average CapEx ratio,” record whether the source is value-weighted (cumulated), equal-weighted (mean) or median, and whether depreciation has been deducted.
How do Census ACES/AIES, NYU Stern sector tables and 10-K filings differ in scope?
Never divide U.S. Census survey capital expenditures by a public company’s 10-K revenue, and never treat the historical Annual Capital Expenditures Survey (ACES) as a current standalone collection.
According to the U.S. Census Bureau’s About ACES documentation (last revised July 24, 2026) and AIES program page (last revised October 1, 2026), ACES transitioned into the Annual Integrated Economic Survey (AIES), which began data collection in March 2024 and consolidated seven annual business surveys (including ACES and the Annual Survey of Manufactures, ASM) into a single survey covering revenues, expenses, payroll, employment and capital spending. See our data sources directory for primary links.
Use the scope comparison table below to verify which dataset matches your research question:
Scroll horizontally to view all columns.
| Scope dimension | U.S. Census ACES (archive through 2022) and AIES (from 2024 collection) | NYU Stern Damodaran US Sector Dataset (Jan 2026) | Single-Company SEC Form 10-K (Item 7 and Item 8) |
|---|---|---|---|
| Covered entity universe | Domestic, private, non-farm employer and nonemployer businesses in the United States | Publicly traded companies included in the U.S. market database (5,994 total firms; 4,822 nonfinancial) | One registrant and its consolidated subsidiaries |
| Geographic boundary | Domestic U.S. operations only; explicitly excludes foreign operations of U.S. businesses and U.S. territories | Global consolidated financial statements of U.S.-listed companies | Global consolidated perimeter (unless segment footnotes report geographic PP&E additions separately) |
| Industry classification | 3-digit and selected 4-digit NAICS industries based on domestic business register activity | Proprietary industry groupings (e.g., Power, Machinery, Packaging & Container) assigned at the whole-company level | Consolidated issuer plus management-defined operating segments under GAAP |
| Capital expenditure definition | New and used structures and equipment chargeable to depreciable asset accounts, including capitalized leasehold improvements and capitalized interest | Cumulated cash-flow statement capital expenditures (generally excluding acquisitions); also reports Net CapEx after depreciation | GAAP cash outflows for PP&E additions in Item 8 investing cash flows, plus any issuer-defined non-GAAP CapEx in Item 7 |
| Revenue denominator | Standalone ACES published capital expenditures only (no revenue column); AIES integrates revenue, expense and capex collection under one survey design | Cumulated trailing-12-month consolidated sales for the exact same listed-firm sample | Consolidated GAAP revenue on the Item 8 income statement for the matching fiscal year |
| Primary comparability trap | Mixing domestic-only NAICS survey capex with global consolidated issuer sales, or splicing pre-2024 ACES and post-2024 AIES without checking survey changes | Treating Net CapEx / Sales as gross CapEx / Revenue, or ignoring how conglomerates are assigned to a single sector |
Comparing two issuers with different lease capitalization, currency translation or fiscal year-ends |
A comparison worksheet you can copy into your research notes
Before comparing capital intensity across two companies or benchmarking a company against a sector table, complete one column per subject and leave any unverified cell blank until you open the primary filing.
Scroll horizontally to view all columns.
| Audit field | Subject A (Company or Sector) | Subject B (Peer or Benchmark) | Verification rule |
|---|---|---|---|
| Source document and locator | Record filing, table and page | Record filing, table and page | Cite exact 10-K Item/page, Census NAICS table or NYU Stern row |
| Period and fiscal year-end | Record fiscal year or LTM date | Record fiscal year or LTM date | Align calendar quarters or fiscal years before dividing |
| Currency and unit scale | Record currency (e.g., USD millions) | Record currency (e.g., USD millions) | Convert numerator and denominator on the same period average rate if needed |
| Geographic and entity perimeter | Consolidated global vs domestic NAICS | Consolidated global vs domestic NAICS | Never divide domestic survey capex by global consolidated revenue |
| Gross CapEx numerator | Unknown / verify in cash-flow statement | Unknown / verify in cash-flow statement | Confirm whether acquisitions, capitalized software and joint-venture advances are excluded |
| Depreciation and amortization | Unknown / verify in cash-flow statement | Unknown / verify in cash-flow statement | Required to reconcile Gross CapEx with Net CapEx and check CapEx ÷ Depreciation |
| Revenue denominator | Unknown / verify in income statement | Unknown / verify in income statement | Match consolidated revenue to consolidated CapEx; exclude intersegment transfers |
| Balance-sheet capital base | Net PP&E or Invested Capital | Net PP&E or Invested Capital | Pair flow intensity (CapEx ÷ Revenue) with stock intensity (Sales ÷ Invested Capital or Net PP&E ÷ Revenue) |
| Lease and outsourcing check | Inspect ROU additions and co-packing notes | Inspect ROU additions and co-packing notes | Check whether equipment is leased or outsourced rather than purchased via cash CapEx |
Method and limitations
This guide synthesizes primary statistical and regulatory documentation opened on October 17, 2026: NYU Stern’s Capital Expenditures by Sector (US) dataset (dated January 2026) and Variables used in Data Set, the U.S. Census Bureau’s About ACES (revised July 24, 2026) and AIES program pages (revised October 1, 2026), and the SEC’s How to Read a 10-K and Beginners’ Guide to Financial Statements.
Sector ratios from NYU Stern reflect listed U.S. companies as of January 2026 and will shift as commodity prices, depreciation schedules, accounting rules and sample membership change. The two-company comparison is a constructed hypothetical example designed solely to demonstrate weighted versus unweighted aggregation and gross versus net formulas. Nothing on this page ranks “best” high-CapEx stocks or provides investment advice; read our terms and research disclaimer for full usage boundaries.
Continue the research
Related Research
Capex vs Opex in Industrial Manufacturing and Machinery
How do industrial companies evaluate the trade-off between capital expenditure and operational expenditure when acquiring packaging and production capacity?
Types of CapEx: Maintenance and Growth
How can a reader identify what capital spending is intended to do without treating a management classification as a standard accounting disclosure?

Oil company profits: drivers, cash flow and capex
What drives oil company profits, and how can researchers trace them into capital spending?
Sources & Data Notes
-
Sector figures are cumulated totals across listed U.S. companies in each industry classification.
-
Defines sector ratios as cumulated numerator divided by cumulated denominator rather than simple averages of firm ratios.
-
Documents domestic private non-farm coverage, capitalized structures and equipment scope, and the March 2024 transition to AIES.
-
Confirms integration of seven annual business surveys, including ACES and ASM, into AIES.
-
Locates audited cash-flow statements, balance sheets, footnotes and non-GAAP reconciliation rules in U.S. annual filings.
-
Explains property, plant and equipment capitalization, depreciation and cash outflows for equipment purchases.