
Largest packaging companies: segment margins and capital returns
Key Takeaways
- Keep external sales, profit definitions and capital boundaries together in each segment record.
- Reported operating income, adjusted EBIT and comparable operating earnings need separate labels.
- Segment assets and annual capital expenditures cannot substitute for invested capital.
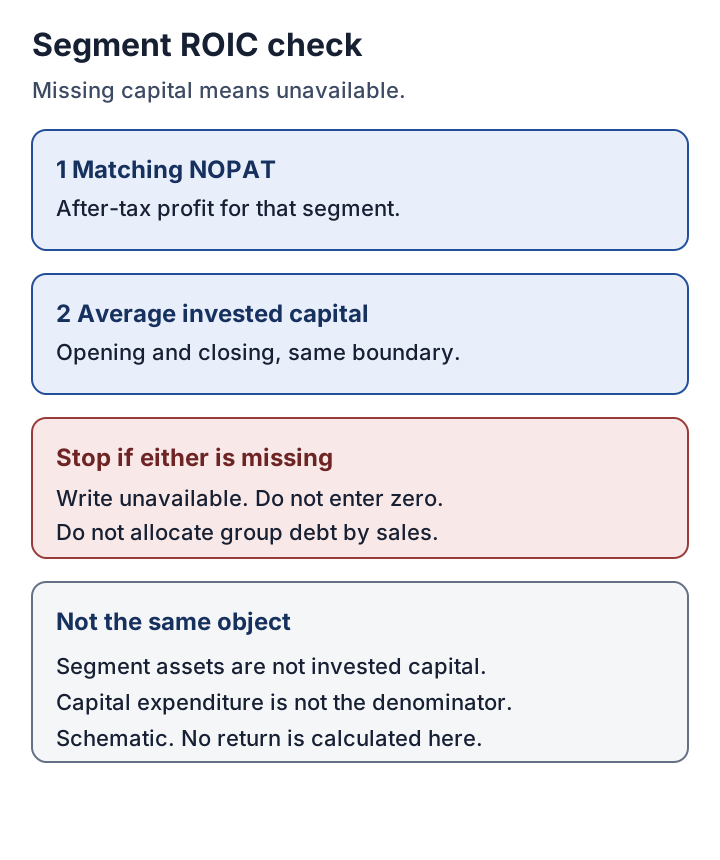
- Leave segment ROIC unavailable when matching capital or tax information is missing.
Research Scope
- Regions
- Company-defined US and international operations; not a global company universe
- Period
- Selected 2025 annual periods; sources checked October 19, 2026
- Industries
- Corrugated packaging, flexible packaging, rigid plastic packaging and aluminum beverage cans
- Data objects
- Segment sales, operating profit measures, assets and capital disclosure gaps
Comparing the largest packaging companies by group sales can waste research time and produce false conclusions about segment margins and capital returns. Read each annual report’s segment note for external sales, the exact profit measure and matching capital disclosures, then calculate only the ratios those fields support.
Separate corrugated boxes, flexible packaging, rigid plastics and metal cans before interpreting profitability. The disclosure examples below preserve each company’s segment boundary and earnings definition; their calculated margins are not a performance ranking. A segment with disclosed earnings but no usable invested-capital denominator has an unavailable ROIC, even when group capital is known. Use the extraction record to retain that gap alongside the figures.
Scroll horizontally to view all columns.
| Input or item | Typical value or source | Why it matters |
|---|---|---|
| Segment sales | External-customer line in the segment note | Internal transfers can inflate a denominator |
| Segment profit | Exact label plus reconciliation | Adjustments change what the margin measures |
| Capital | Matching operating assets and liabilities, or defined invested capital | Gross assets alone do not establish ROIC |
| Period | Annual-report year-end and acquisition dates | A shared year label can cover different businesses and months |
What should the four segment lanes contain?
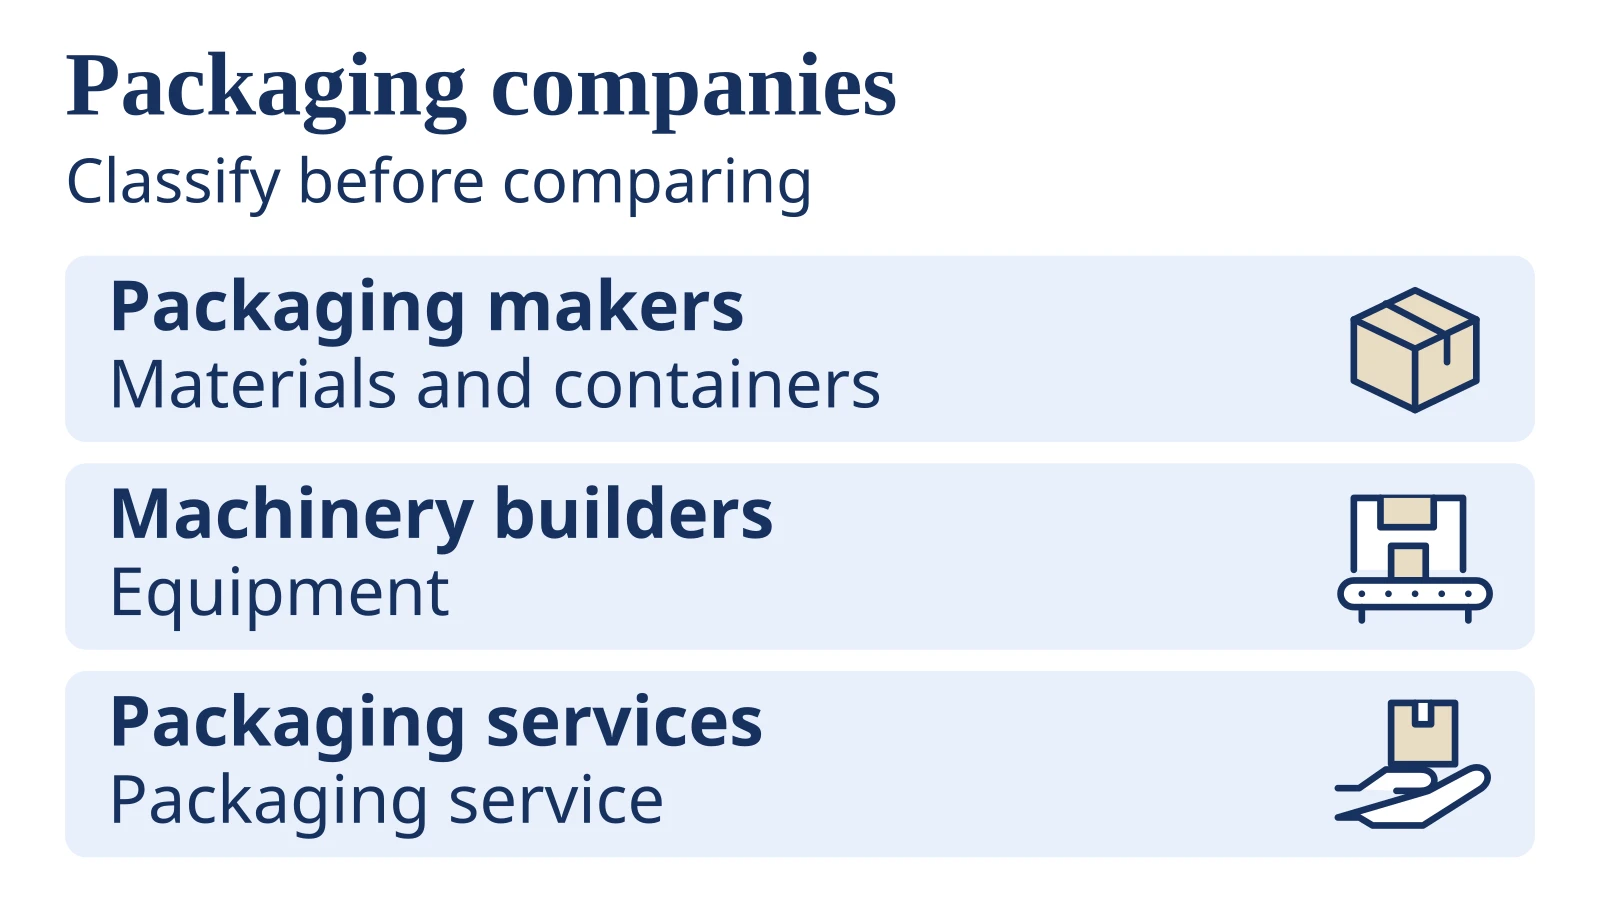
Keep the product lanes separate while retaining the company’s actual reporting perimeter. The packaging-company classification guide covers the initial material, format and region checks. The additional task here is to connect those activities to earnings and capital, within the wider packaging industry research guide.
Scroll horizontally to view all columns.
| Product lane | Earnings and capital questions to resolve | Dominant Failure Mode & Prevention |
|---|---|---|
| Corrugated boxes and containerboard | Does the segment combine mills and converting plants? Where are shared logistics assets held? | Counting mill transfers as additional external business; use external sales and retain eliminations |
| Flexible packaging | Does the line combine film, laminates, foil or other converted products? Which earnings exclusions apply? | Calling a mixed segment a pure film business; preserve the disclosed product perimeter |
| Rigid plastic packaging | Are closures and dispensing products included with containers? Has an acquisition changed the asset base? | Comparing an enlarged closing balance sheet with a partial year of acquired earnings; record acquisition timing |
| Metal cans | Is the segment beverage-only and regional? What remains outside comparable operating earnings? | Treating regional aluminum beverage cans as all metal packaging; retain product and geography labels |
These are research questions, not assertions that every company uses these boundaries. The packaging value chain helps distinguish upstream materials, converters and machinery when a report combines stages.
What do the opened segment notes support?
They support four separately labeled margins, with material limits on capital-return analysis. All monetary amounts below are USD millions. Margins are calculated here as the displayed profit divided by the displayed segment sales, rounded to two decimal places. Rows follow product lanes rather than size or margin order.
Scroll horizontally to view all columns.
| Company, annual period and reported segment | Segment sales | Disclosed profit measure and amount | Calculated margin | Exact filing locator |
|---|---|---|---|---|
| PCA; year ended December 31, 2025; Packaging | 8,293.9 external sales | Income from operations: 1,125.3 | 13.57% operating margin | 2025 10-K, Note 19, p. 72 |
| Amcor; year ended June 30, 2025; Global Flexible Packaging Solutions | 10,872 net sales | Adjusted EBIT: 1,458 | 13.41% Adjusted EBIT margin | 2025 10-K, Note 21, p. 107 |
| Amcor; year ended June 30, 2025; Global Rigid Packaging Solutions | 4,137 net sales | Adjusted EBIT: 375 | 9.06% Adjusted EBIT margin | 2025 10-K, Note 21, p. 107 |
| Ball; year ended December 31, 2025; Beverage packaging, North and Central America | 6,286 net sales | Comparable segment operating earnings: 772 | 12.28% comparable operating margin | 2025 10-K, Note 3, p. 52 |
Sources: PCA Note 19, Amcor Note 21 and Ball Note 3, opened October 19, 2026. Amcor says intersegment sales are immaterial. Its fiscal period differs from the calendar years used by the other examples.
PCA’s Packaging segment includes containerboard and corrugated products. Its note leaves some assets and liabilities associated with allocated expenses in Corporate and Other. Amcor defines Adjusted EBIT using exclusions and includes affiliate earnings net of tax. Ball’s comparable earnings reconcile through corporate and other items, business consolidation effects and acquired-intangible amortization. Those differences must be resolved before using the margins as evidence of relative economics.
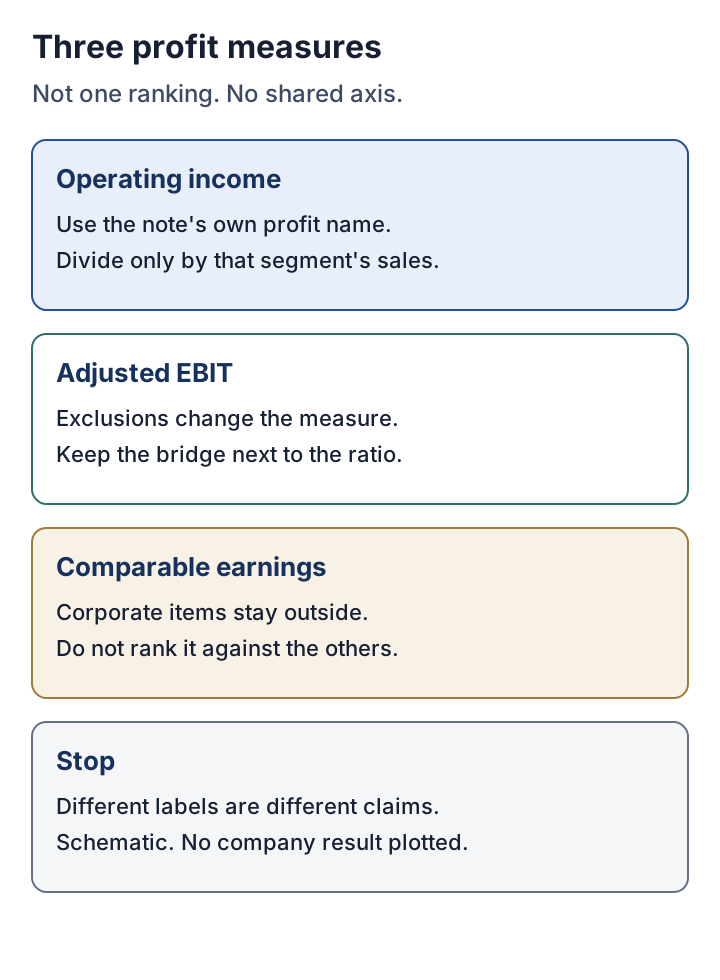
Keep acquisition timing in the same record. PCA Note 19 includes the acquired Greif business from September 2, 2025; Amcor Note 4 dates its Berry merger to April 30, 2025. Neither example supplies a full year of the acquired operations merely because the closing balance sheet includes them.
How do the margin and return formulas differ?
A margin measures profit per unit of revenue; ROIC measures after-tax operating profit against capital committed to the matching activity. Use the precise disclosed profit name in a reported-margin calculation. Moving from that number to comparable operating profit requires a documented adjustment bridge.
Segment margin (%) = matching segment profit / segment external sales × 100
NOPAT = comparable operating profit × (1 − applicable operating tax rate)
Average invested capital = (opening invested capital + closing invested capital) / 2
ROIC (%) = NOPAT / average invested capital × 100
Assumed worked example — all inputs are assumed USD millions for an unnamed business: sales 1,000, comparable EBIT 100, operating tax rate 25%, opening capital 450 and closing capital 550 give margin 100 / 1,000 × 100 = 10% and ROIC 100 × (1 − 0.25) / ((450 + 550) / 2) × 100 = 15%.
These assumed results describe no company in the disclosure table. The tax expression is a simplified teaching model; an actual NOPAT bridge may require more detailed tax adjustments. When capital changes materially during a year, two balance-sheet observations can also be insufficient: use a supported time-weighted measure or leave the return unresolved.
When must segment ROIC stay unavailable?
Leave it unavailable whenever the capital or after-tax profit bridge cannot be supported. A reported asset amount is useful evidence about the denominator problem, but it is not permission to relabel assets as invested capital.
Scroll horizontally to view all columns.
| Segment record | Capital evidence actually opened | ROIC conclusion |
|---|---|---|
| PCA Packaging | USD 9,354.8 million assets at December 31, 2025; Note 19, p. 72 | Unavailable from this note: assets are not a matched invested-capital measure |
| Amcor flexible and rigid segments | Note 21, p. 109 explicitly omits segment total assets | Unavailable: segment invested capital cannot be reconstructed from these fields |
| Ball regional beverage segments | Note 3, p. 53 explicitly omits segment total assets | Unavailable: geographic long-lived assets do not supply segment invested capital |
Sources are the same three annual reports linked above. None of these rows establishes segment ROIC. Allocating group debt, goodwill or working capital in proportion to revenue would introduce assumptions; it would not recover a disclosed segment denominator.
Rules of Thumb
Use these editorial validation thresholds, rather than sector return targets:
- One missing capital bridge is enough to stop ROIC. If operating liabilities, shared-asset treatment or the capital definition is unresolved, enter “unavailable.” Do not enter zero.
- Require at least two dated capital observations for an opening/closing average, with the same segment boundary. Acquisition timing can require more observations or a different method.
- Use zero unexplained reconciliation difference beyond rounding. For a total and its components, allow the sum of their displayed half-unit rounding bounds; investigate a larger residual before accepting the extraction.
- Use a positive sales denominator. If matching external sales are zero or unavailable, leave the ordinary profit-margin ratio undefined rather than forcing a percentage.
Which cost and investment items need a separate bridge?
Keep material costs, conversion expenses and capital spending distinct. An integrated paper segment can contain fibre, energy, mill maintenance and box conversion; flexible and rigid businesses require their own resin, substrate, converting and forming disclosures; can research needs the metal and conversion boundary. These categories are prompts to inspect the relevant accounts, not assumed company cost shares.
For paper exposure, use paper and packaging board grades and pricing to distinguish a grade-level cash spread from segment operating profit. A tonne spread still needs a volume and expense bridge before it can explain the segment result. The packaging price-index method handles the separate index question.
Retain freight, scrap, changeovers, maintenance outages, working-capital requirements and corporate allocations as questions where disclosure is missing. Do not assign numerical savings or costs to them. Annual capital expenditures are a flow; they are not the stock of capital supporting annual earnings. The capital intensity guide develops that distinction.
What should the reusable extraction record preserve?
Preserve the source labels and unresolved bridges before drawing a comparison. Copy this header and complete one row per segment and period:
Company | Fiscal year-end | Currency/unit | Segment/products/region |
External sales | Exact profit label | Profit amount | Note/page |
Profit reconciliation | Opening/closing capital definition and dates |
Tax basis | Acquisition/disposal timing | Shared assets/liabilities |
Calculated margin label | ROIC or reason unavailable | Access date
Compare a segment with its own prior periods only after checking recast definitions and ownership changes. Compare different companies only after documenting the remaining accounting differences. A missing bridge is itself a usable research result: it identifies the evidence required for the next step without inventing an industry ranking.
Method and sources
This framework uses selected 2025 annual disclosures opened October 19, 2026. It is a fixed-period teaching sample, not a claim to cover every large packaging company or the latest filing of every issuer. Source-note locators identify the reproduced amounts; the displayed margins are arithmetic derived here. The formulas, extraction record and validation thresholds are editorial methods. The worked example is entirely assumed.
Use subsequent filings when updating a company record. No security recommendation, target price, expected return or sector ROIC is inferred from this sample.
Last updated: October 19, 2026.
Continue the research
Related Research
Packaging industry companies: how to compare their businesses
How can readers identify packaging businesses and compare their scale without mixing different revenue, material or geographic boundaries?

Packaging costs: how to read price indexes
How can researchers track packaging cost pressures without confusing producer selling prices with a manufacturer's total costs?

Paper and packaging board: grades, capacity and pricing spreads
How do paperboard grades, capacity denominators and cash-cost boundaries change a per-tonne pricing-spread analysis?
Sources & Data Notes
-
External sales, income from operations and assets; original note passages opened from the issuer-hosted PDF.
-
Year ended June 30, 2025; net sales, Adjusted EBIT, reconciliation and non-disclosure of segment assets.
-
Regional beverage packaging sales and comparable operating earnings; segment assets not disclosed.