
Paper and packaging board: grades, capacity and pricing spreads

Key Takeaways
- Kraftliner and recycled medium belong to corrugated board; SBS and FBB are distinct cartonboard grades.
- Machine capacity, actual production and shipments require separate records.
- A cash spread requires matching grade, tonne basis, period and revenue/cost boundary.
- A grade-level spread is not a company segment margin or return on invested capital.
Research Scope
- Regions
- European grade and capacity definitions; research method applicable only with matched local evidence
- Period
- 2025 Cepi definitions; 2015 technical reference; dated April 2024 company capacity example
- Industries
- Containerboard and cartonboard; excludes paper-price forecasting
- Data objects
- Grade definitions, annual capacity, production, net realization and cash-cost scope
Pooling paper and packaging board grades can waste research time and misstate pricing spreads by treating product-mix changes as profit changes. Separate kraftliner, recycled corrugating medium, SBS and FBB, then match grade, capacity basis and saleable tonnes before defining a per-tonne cash spread.
Kraftliner is a liner for corrugated board, recycled medium forms its fluted layer, and SBS and FBB are different cartonboard constructions. Their fibre recipes and production boundaries require different cost records. Capacity is a potential annual rate, production is actual output, and pricing analysis needs a defined net selling value rather than an index level. This guide supplies a comparison and calculation method; it publishes no observed grade prices or cash-cost estimates.
Scroll horizontally to view all columns.
| Input or item | Typical value or source | Why it matters |
|---|---|---|
| Grade and construction | Association definition and mill product description | “White board” can conceal different fibre recipes |
| Capacity | Machine, grade, tonnes/year, effective date and source definition | Installed capacity is not realized annual output |
| Production and shipments | Separate physical-volume records | Inventory changes can separate making from selling |
| Revenue and cash cost | Same grade, period and saleable-tonne basis | A mismatched denominator produces a false spread |
What distinguishes the four grades?
Kraftliner and medium are inputs to corrugated board, while SBS and FBB belong to cartonboard. Cepi’s 2025 definitions, section 7.2.2 distinguish liners from the middle fluting layer and separate containerboard from cartonboard. The comparison below combines those definitions with the technical references linked immediately after it.
Scroll horizontally to view all columns.
| Grade | Fibre construction and position | Cost components to investigate, without assumed shares | Dominant Failure Mode & Prevention |
|---|---|---|---|
| Kraftliner | Primary-fibre linerboard; an outer facing of corrugated board | Wood or pulp supply, pulping/recovery where integrated, energy, chemicals and papermaking | Treating a liner price as a complete corrugated-box price; separate medium, corrugating and box conversion |
| Recycled corrugating medium | Recovered-fibre paper forming the fluted middle layer; distinct from semi-chemical medium | Recovered paper, stock preparation, rejects, energy, additives and maintenance | Equating purchased recovered-paper tonnes with saleable medium tonnes; document yield and reject handling |
| SBS / SBB | Solid bleached board made from bleached chemical pulp | Pulp, coating, energy, finishing and the applicable mill boundary | Pooling all bright white cartonboard into SBS; confirm the actual fibre construction |
| FBB | Mechanical-pulp middle layers between chemical-pulp outer layers | Both pulp streams, energy, coating, finishing and mill integration | Treating equal tonnes of SBS and FBB as equal package area or performance; retain grammage and specification |
The European Commission JRC’s 2015 pulp, paper and board reference, page 677 describes primary-fibre kraftliner, recycled testliner and the alternative furnish routes for medium. Pro Carton’s cartonboard glossary, pages 4–5 distinguishes bleached chemical-pulp SBS from the mechanical/chemical-pulp structure of FBB. “Recycled” alone does not identify medium: recycled linerboard is a separate product.
Colour is not a sufficient grade specification. Keep coating, grammage, intended conversion and the mill’s grade label in the record. None of these broad definitions certifies a specific board for food contact or establishes an interchangeable substitute. The packaging value chain places the paper mill upstream of the converter and packing line.
How should capacity and production denominators match?
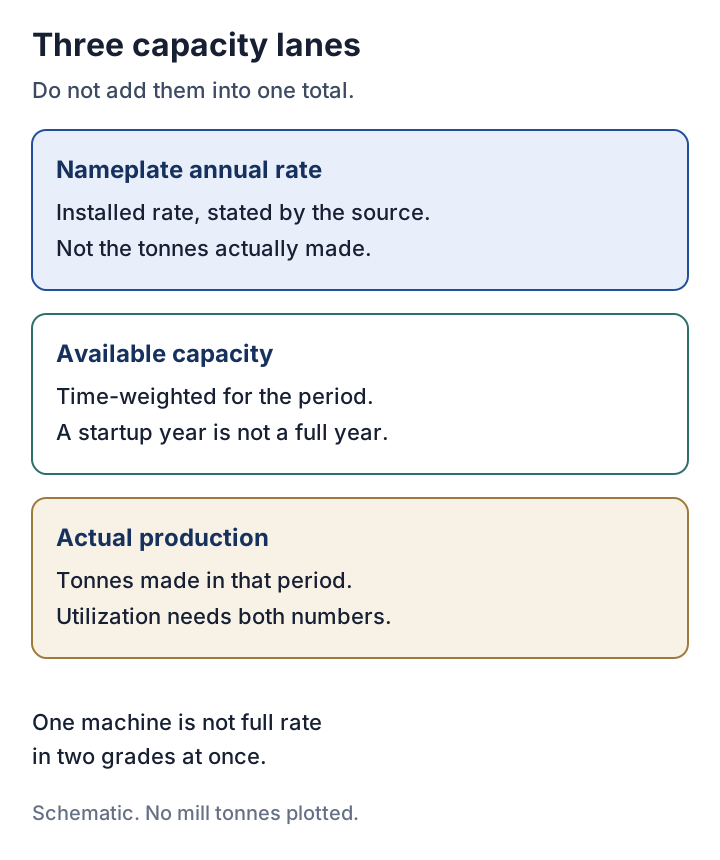
Use capacity and production for the same grade, equipment, unit and period. Cepi section 1.3 defines practical maximum annual capacity under stated operating and supply assumptions, apportions multigrade machines, and reports finished paper and board in metric tonnes. Its pulp measure uses a different moisture basis. These distinctions prevent mixing pulp input tonnes, paper output tonnes and area shipped by converters.
In the research record, distinguish:
- Installed annual rate: the stated annual capability at a specified date.
- Period-available capacity: capacity attributed to the period under the source’s timing and ramp-up convention.
- Production: tonnes actually made within that period and boundary.
- Shipments: tonnes dispatched or sold, recorded separately from production.
A machine that alternates between grades cannot contribute its full annual rate to each grade simultaneously. Preserve the allocation assumption. For new or converted equipment, use the source’s available-capacity method; do not invent a generic start-up utilization rate. Cepi also notes that subsectors may use specific capacity rules.
Metsä Board’s April 12, 2024 Husum release states that the BM1 upgrade completed in 2023 raised annual folding-boxboard capacity to 600,000 tonnes/year. That is a dated, machine-specific FBB capacity statement. It is not evidence of actual production, a present-year operating rate, or saleable capacity for every other grade made at the Husum site.
Utilization (%) = actual production in period / capacity available for the same period × 100Assumed capacity example — unrelated to Husum: assumed full-year available capacity of 120,000 metric tonnes and assumed production of 90,000 metric tonnes give 90,000 / 120,000 × 100 = 75% utilization.
If output is reported in area, retain grammage before converting it to mass. In consistent units, mass (metric tonnes) = area (m²) × grammage (g/m²) / 1,000,000. This dimensional identity does not make different grades equivalent: a tonne’s coverage changes with grammage, and package performance needs its own evidence.
How should a per-tonne cash spread be defined?
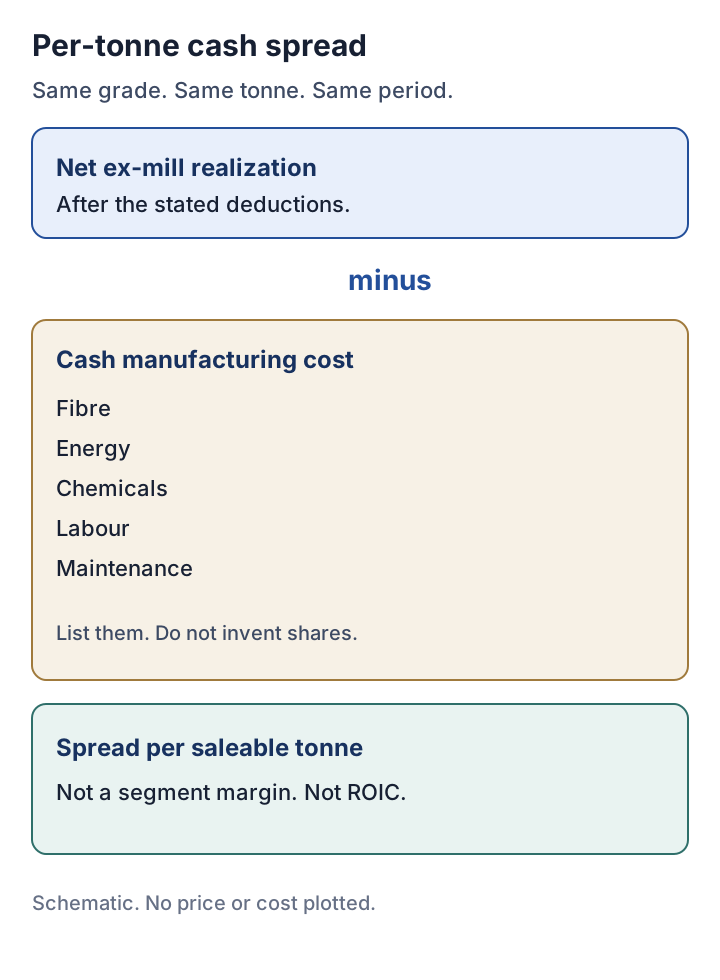
Define it as matching net realized selling value less a stated set of cash manufacturing costs, both per saleable tonne. This is an analytical definition for the research record, not a standardized reported metric. Changing the expense boundary changes the answer.
Net realization per tonne = grade sales after stated deductions / matching tonnes sold
Cash manufacturing cost per tonne = scoped cash manufacturing costs / matching saleable production tonnes
Cash spread per tonne = net realization per tonne − cash manufacturing cost per tonne
Use a consistent ex-mill basis: identify rebates, returns and freight adjustments, and ensure freight is treated on the same basis on both sides. Keep the revenue deductions and cost inclusions visible. If shipments and production differ, reconcile inventory and the cost recognition basis before treating the two per-tonne observations as a matched realized spread. Otherwise report them separately or mark the result as a scenario.
Assumed spread example — all inputs are hypothetical monetary units (MU): assumed matched net realization of 100 MU per saleable metric tonne less assumed scoped cash manufacturing cost of 70 MU/t gives 100 − 70 = 30 MU/t; this is no quoted price, company result or observed grade spread.
A recovered-paper price is only one input to a recycled-medium model. On a specified net fibre basis, purchased fibre required per saleable tonne = 1 / fibre yield. The yield needs evidence for that process; moisture, additives and coating can change how reported masses relate. Do not apply this simplified fibre identity indiscriminately to total board mass.
For index selection and interpretation, use the existing packaging costs and price indexes guide. An index cannot supply the missing currency-per-tonne selling price or cash cost in these equations. Unopened proprietary price assessments do not fill that gap either.
Which cash costs and integration effects belong in the record?
List the cost categories and boundary before attaching amounts. Fibre or purchased pulp, recovered-paper preparation, purchased energy, chemicals and coatings, direct labour, maintenance consumables, reject disposal and relevant site overhead are possible components to verify. Identify outsourced operations and internal transfers separately. No proportions or market cost estimates are assumed here.
For an integrated mill, choose either a supported transfer-price view or a consolidated production-cost view and explain it. Including the internal pulp charge and then adding all costs of making that same pulp would double count. A purchased-pulp mill and an integrated pulp-and-board site therefore need a cost bridge even when they sell a similar board grade.
Depreciation, financing, corporate expenses and capital expenditures require separate treatment. If depreciation is excluded from the cash spread, the result cannot be labeled an operating margin. If capital expenditure is omitted, the spread cannot establish free cash flow. Maintenance shutdowns, grade changes and inventory tie-ups also require their own evidence before a projected saving can be quantified.
Continue with the largest packaging companies segment breakdown to connect grade economics with disclosed segment profit and the limits on ROIC. The packaging industry guide supplies the wider boundary; grade-level costs alone do not establish machinery demand or an investment return.
Rules of Thumb
Apply these research checks, which are thresholds for accepting a calculation rather than physical specifications for every mill:
- Require 100% of aggregated rows to identify grade, unit, period and capacity basis. One unknown row prevents a defensible total until it is resolved or explicitly excluded.
- Investigate utilization above 100%. Check denominator vintage, upgrades, product mix and time allocation. A published capacity estimate can be exceeded; the ratio is a verification trigger, not proof of an impossible result.
- Require fibre yield greater than zero and no more than 1 for the defined net fibre recovery model. A value outside that interval calls for a unit, moisture, additive or boundary check before using
1 / yield. - Use zero unexplained freight or transfer-cost overlap. If an item appears in both net-realization deductions and manufacturing costs, reconcile it before calculating the spread.
These checks can establish that the inputs are internally consistent. They cannot establish a competitive cash-cost position without comparable source data from the mills being studied.
What should the evidence record preserve?
Preserve physical and financial definitions together. A source that reports a grade’s capacity does not automatically support its production, selling price or cost.
Mill/machine | Grade/furnish/coating/grammage | Geography |
Capacity unit/basis/effective date | Source ramp-up convention |
Actual production | Shipments | Inventory bridge |
Net realization basis | Cash-cost inclusions/exclusions |
Fibre yield and moisture basis | Internal transfers |
Currency and period | Source URL/page/table | Access date | Remaining gap
Leave an unobserved price or cost blank, and label any scenario inputs assumed. The record remains useful when it establishes only the grade and capacity boundary: it tells the next researcher exactly which missing observation prevents a spread calculation.
Method and sources
Grade descriptions use Cepi, Pro Carton and the JRC technical reference. The Husum example reproduces a dated company capacity statement, rather than a current supply estimate. All sources were opened October 19, 2026. The spread definition, record fields and verification thresholds are editorial synthesis. The two numeric worked examples are explicitly assumed and provide no market price, cash-cost benchmark or named-company profitability estimate.
Last updated: October 19, 2026.
Continue the research
Related Research

Packaging costs: how to read price indexes
How can researchers track packaging cost pressures without confusing producer selling prices with a manufacturer's total costs?

Largest packaging companies: segment margins and capital returns
How can researchers compare packaging segment profitability without ranking unlike businesses or inventing segment invested capital?
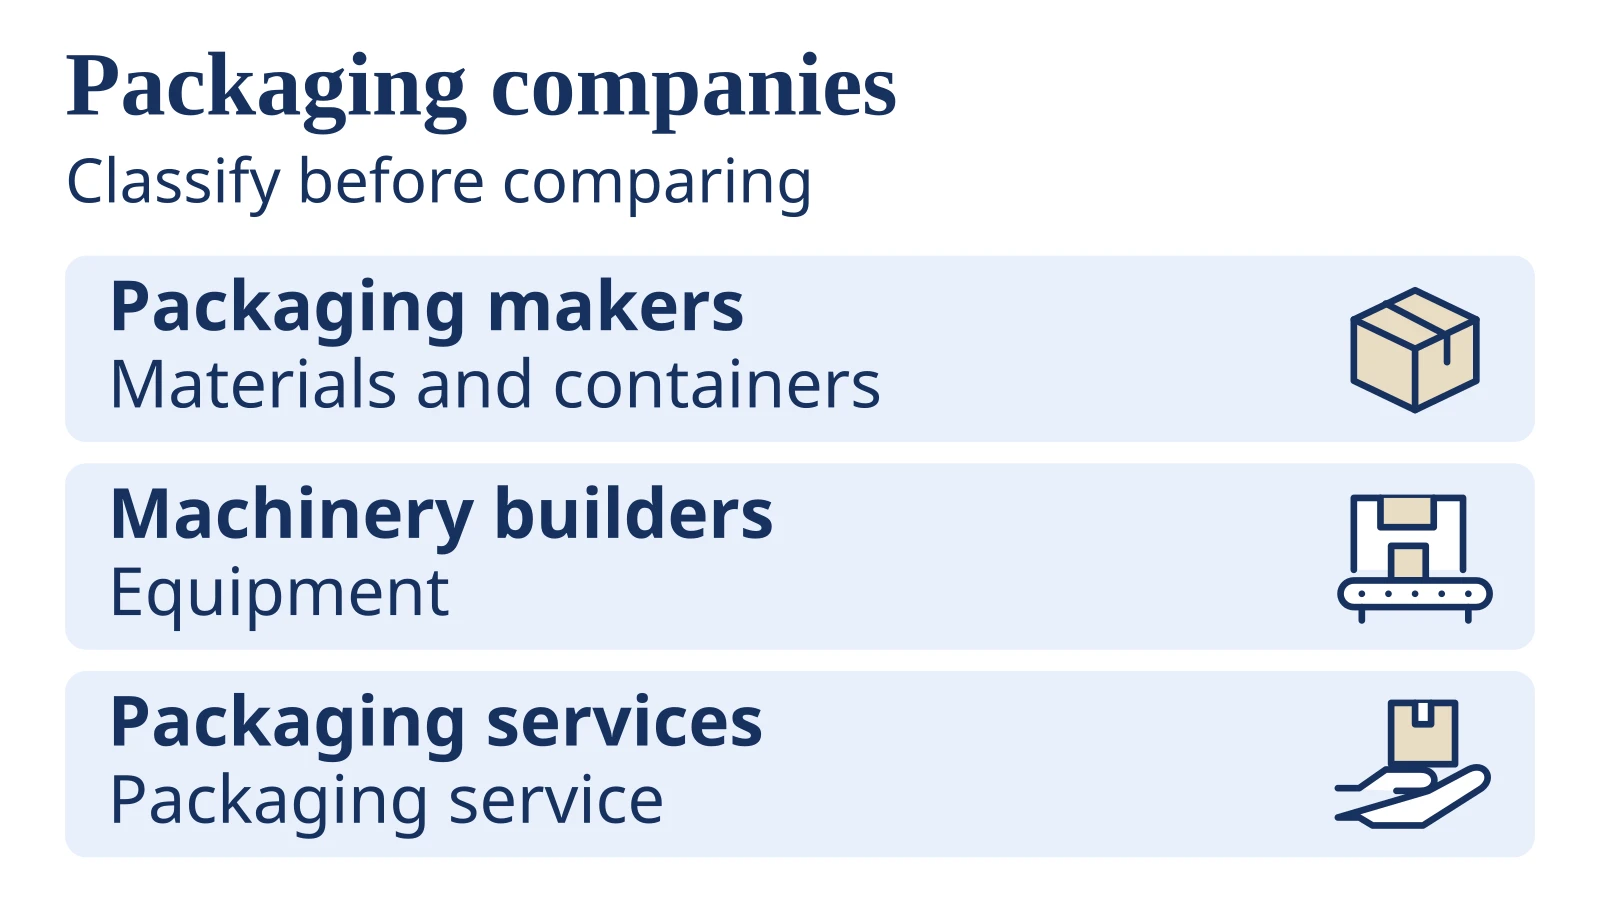
Packaging industry companies: how to compare their businesses
How can readers identify packaging businesses and compare their scale without mixing different revenue, material or geographic boundaries?
Sources & Data Notes
-
January 2025 definitions; practical maximum capacity, grade allocation, units and product families.
-
Technical grade descriptions; not current price, cost or market-capacity evidence.
-
Material definitions; no grade price or universal performance threshold inferred.
-
Dated machine-capacity example, not actual production or an estimate of current available supply.