
How to Read the BLS Producer Price Index (BLS PPI) for Paperboard: PCU vs WPU Series, Base Periods, and Revisions
Key Takeaways
- Commodity price series group paperboard and packaging products by similarity of end use or material composition, regardless of whether the products are classified as primary or secondary in their industry of origin, whereas industry price series track the net output of producers organized by NAICS.
- Every producer price series is scaled to its own historical reference period, meaning raw index point levels cannot be compared across grades without first rebasing to a shared starting date.
- Initial monthly producer price observations are flagged as preliminary and remain subject to revision for up to four months after original publication.
In the BLS Producer Price Index (bls ppi) Current Commodity Series (WP), about 10,000 PPIs for individual products and groups of products are released each month, and the PPI program covers approximately 70 percent of the service sector’s output as measured by revenue reported in the 2017 Economic Census. Prices used in constructing each ppi index are the actual revenue or net transaction prices producers receive for sales of their outputs, selected using scientific probability sampling techniques for all types and volumes of output. For equity analysts covering packaging industry research and procurement teams benchmarking containerboard and carton supply agreements, tracking the right paperboard price series requires separating primary mill rollstock from downstream converted containers.
The U.S. Producer Price Index (PPI) uses a standard Base Period of 1982 = 100, was formerly named the Wholesale Price Index (WPI) (Pre-1978), and was first tracked in 1902. Across the historical archive, all data through June 2021 are stored with one decimal place, and data after June 2021 are stored with 3 decimal places. In flat data files, each observation line records a series identification code, observation year, observation period (where M13, Q05, and S03 indicate annual averages), index value, and footnote code.
How the BLS producer price index measures paperboard prices
The commodity classification structure starts with major commodity groupings at the 2-digit level of aggregation and descends through subgroups at the 3-digit level, product classes at the 4-digit level, subproduct classes at the 5- and 6-digit level, item groupings at the 7-digit level, and individual items at the 8-, 9-, and 10-digit levels. The Commodity database provides more than 4,000 commodity price indexes organized by product, service, and end use, along with Final Demand-Intermediate Demand (FD-ID) and Inputs to Industries indexes (some back to 1947) and major 2-digit groupings, while seasonally adjusted data are available for about 360 commodity indexes. That net realization framework matters directly when auditing packaging cost index series and cost drivers and inventory turnover for packaging converters, because the PPI uses actual revenue or net transaction prices producers receive for sales of their outputs.
Monthly updates are released near the middle of the month following a reference month, and data are subject to monthly revisions up to four months after original publication, while discontinued indexes move from the WP to the WD database. In published data tables, footnote code C denotes a Correction and footnote code P denotes Preliminary, meaning all indexes are subject to monthly revisions up to four months after original publication. In the Public Data API response for WPU0914, the 2026 M09 (September) observation of 379.475 is marked latest: true and carries footnote code P (Preliminary), stating that all indexes are subject to monthly revisions up to four months after original publication.
PCU vs WPU series architecture: industry output vs commodity classification
A Commodity series identifier such as WPS00000000 breaks out into survey abbreviation WP, seasonal code S, group code 00, and item code 000000. The Producer Price Index Revision-Current Series (PC) indexes reflect price movements for the net output of producers organized according to the North American Industry Classification System (NAICS) and are compatible with NAICS-based productivity, production, employment, wages, and earnings time series. Industry PC coverage includes roughly 500 mining and manufacturing industries and approximately 150 services industries, measures changes in prices received by domestic producers (import products are not priced in the survey), and collects over 100,000 price quotations each month covering over 600 industries and over 6,000 products and product categories. Industry PC updates are usually available on or before the 15th day of the month following a reference month, and effective with the release of January 2004 data, the PPI program converted from the SIC System to the NAIC System, storing SIC history in the PD database. An Industry series identifier such as PCU11330011330041300 breaks out into survey abbreviation PC, seasonal code U, industry code 113300, and product code 11330041300. In Corrugated and Solid Fiber Box Manufacturing (322211), upstream virgin kraftliner and recycled medium mills sit in 322130 (Paperboard Mills), so summing 322130 and 322211 RCPTOT double-counts paperboard rollstock (where PCA produces 5,154k tons of board and ships 71.1 BSF of corrugated products). When evaluating vertically integrated containerboard and box producers in segment reporting in a packaging company annual filing or comparing largest packaging companies segment margins, that industry boundary explains why summing 322130 and 322211 RCPTOT double-counts paperboard rollstock.
Scroll horizontally to view all columns.
| Classification dimension | Industry net output series (PCU prefix) | Commodity product series (WPU prefix) |
|---|---|---|
| Primary organizing taxonomy | North American industry classification of the reporting establishment | Material composition and end-use product classification regardless of primary or secondary industry origin |
| Series code anatomy | Survey prefix, seasonal code, establishment industry code, and product code | Survey prefix, seasonal code, major group code, and hierarchical item code |
| Value chain rollstock boundary | Separates upstream paperboard mills from downstream box converting plants | Groups physical rollstock and converted containers under allied pulp and paper items |
| Primary analytical application | Benchmarking segment revenue realization and industry-wide gross output | Escalating grade-specific supply contracts and comparing raw substrate inflation |
Core paperboard and converted box PPI series directory
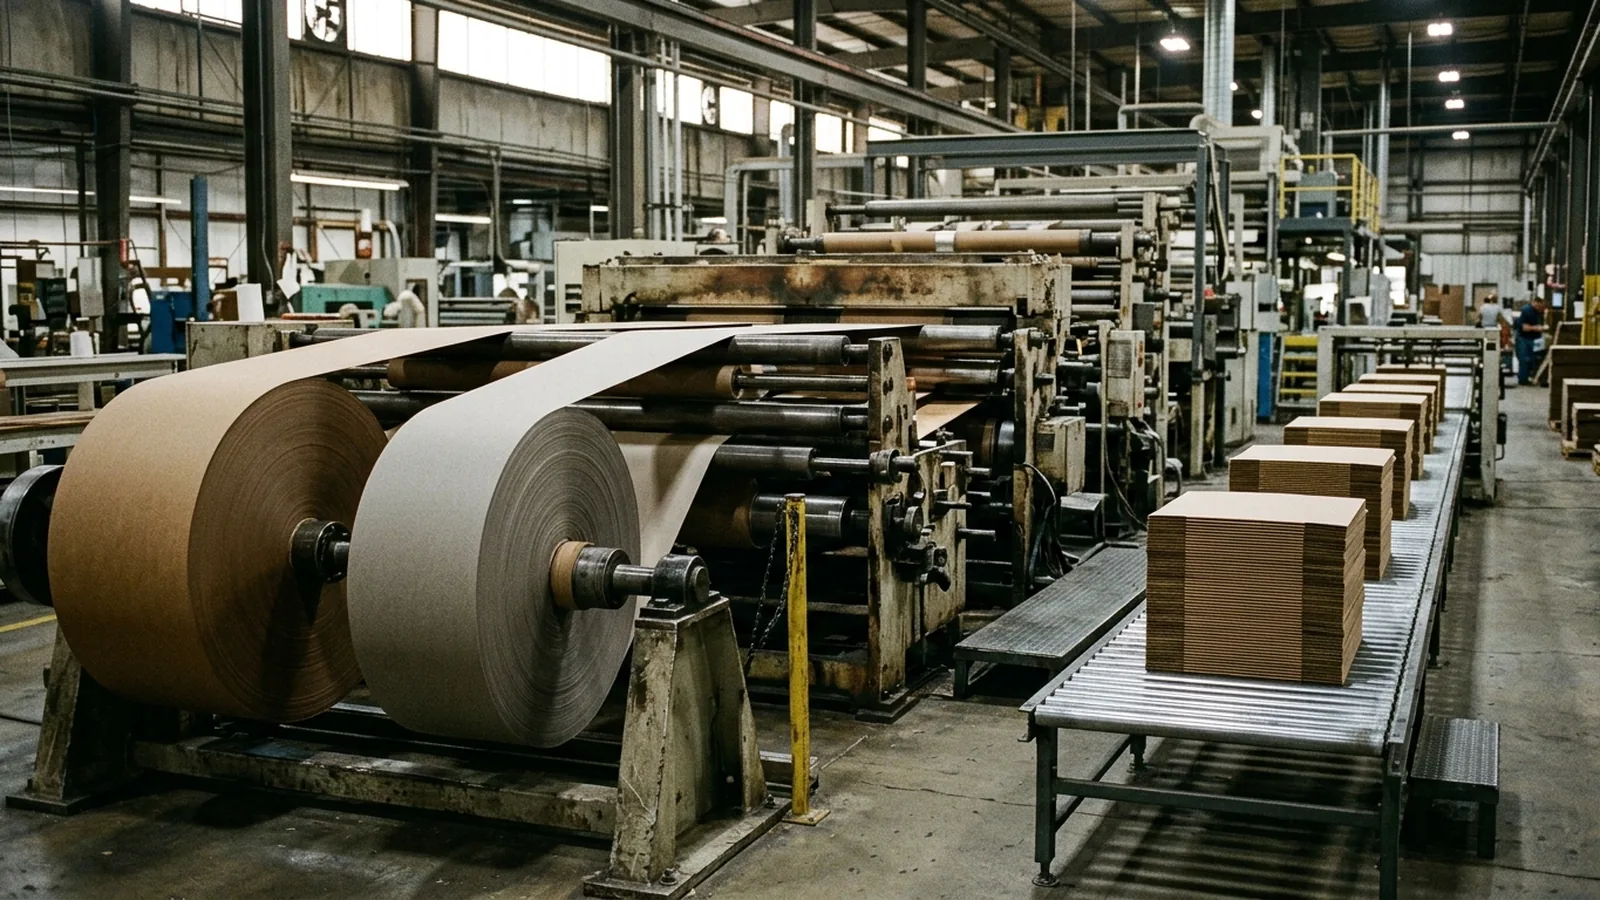
Seasonally adjusted commodity series WPS0914 for Pulp, paper, and allied products-Paperboard (group code 09, item code 14, base date 198200) began in 1967 M01 and ended in 1994 M12. Seasonally adjusted commodity series WPS091503 for Pulp, paper, and allied products-Paper boxes and containers (group code 09, item code 1503, base date 198200) began in 1973 M01 and ended in 2007 M12. Active commodity series WPU0914 tracks Pulp, paper, and allied products-Paperboard (not seasonally adjusted, group code 09, item code 14, seasonal code U) with base date 198200 from 1926 M01 through 2026 M09. Active commodity series WPU091405 tracks Corrugated paperboard in sheets and rolls, lined and unlined (not seasonally adjusted, group code 09, item code 1405, seasonal code U) with base date 198200 from 1980 M06 through 2026 M09. Active commodity series WPU091411 tracks Paperboard, excluding corrugated paperboard in sheets and rolls (not seasonally adjusted, group code 09, item code 1411, seasonal code U) with base date 198212 from 1982 M12 through 2026 M09. Discontinued commodity series WPU09141104 tracked Semichemical paperboard, including corrugating medium (not seasonally adjusted, group code 09, item code 141104, base date 198212) from 1982 M12 until ending in 2014 M13. Active commodity series WPU09141105 tracks Recycled paperboard (not seasonally adjusted, group code 09, item code 141105, seasonal code U) with base date 198212 from 1982 M12 through 2026 M09. Active commodity series WPU09141107 tracks Unbleached kraft packaging and industrial converting paperboard (not seasonally adjusted, group code 09, item code 141107, seasonal code U) with base date 199912 from 1999 M12 through 2026 M09. Discontinued commodity series WPU09141112 tracked Bleached packaging and industrial converting paperboard (not seasonally adjusted, group code 09, item code 141112) with base date 202105 from 2021 M05 through 2025 M04.
Active commodity series WPU091503 tracks Paper boxes and containers (not seasonally adjusted, group code 09, item code 1503, seasonal code U) with base date 198200 from 1947 M01 through 2026 M09. Active commodity series WPU09150301 tracks Corrugated shipping containers (not seasonally adjusted, group code 09, item code 150301, seasonal code U) with base date 198706 from 1987 M06 through 2026 M09. Active commodity series WPU09150336 tracks Folding paperboard boxes, packaging, and packaging components (not seasonally adjusted, group code 09, item code 150336, seasonal code U) with base date 200412 from 2004 M12 through 2026 M09. Active commodity series WPU072A tracks Rubber and plastic products-Plastic packaging products (not seasonally adjusted, group code 07, item code 2A, seasonal code U) with base date 200612 from 2006 M12 through 2026 M09.
Active industry sub-sector series PCU322—322— tracks Paper manufacturing (not seasonally adjusted, industry code 322—, product code 322—, seasonal code U) with base date 200312 from 2003 M12 through 2026 M09. Active industry series PCU322130322130 tracks Paperboard mills (not seasonally adjusted, industry code 322130, product code 322130, seasonal code U) with base date 198212 from 1974 M12 through 2026 M09. Active industry product series PCU3221303221301 tracks Paperboard mills-Unbleached kraft packaging and industrial converting paperboard (not seasonally adjusted, industry code 322130, product code 3221301, seasonal code U) with base date 198212 from 1975 M12 through 2026 M09. Discontinued industry product series PCU3221303221305 tracked Paperboard mills-Semichemical paperboard, including corrugating medium (not seasonally adjusted, industry code 322130, product code 3221305, base date 198212) from 1975 M12 until ending in 2014 M13. Active industry product series PCU3221303221307 tracks Paperboard mills-Recycled paperboard (not seasonally adjusted, industry code 322130, product code 3221307, seasonal code U) with base date 198212 from 1975 M12 through 2026 M09. Discontinued industry product series PCU322130322130B tracked Paperboard mills-Bleached packaging and industrial converting paperboard (not seasonally adjusted, industry code 322130, product code 322130B) with base date 202105 from 2021 M05 through 2025 M04. Active industry product series PCU322130322130P tracks Paperboard mills-Primary products (not seasonally adjusted, industry code 322130, product code 322130P, base date 198212) from 1982 M12 through 2026 M09. Discontinued industry product series PCU322130322130S tracked Paperboard mills-Secondary products (not seasonally adjusted, industry code 322130, product code 322130S, base date 198212) from 1982 M12 through 2022 M10.
Active industry series PCU322211322211 tracks Corrugated and solid fiber box manufacturing (not seasonally adjusted, industry code 322211, product code 322211, seasonal code U) with base date 198003 from 1980 M03 through 2026 M09. Within box converting, Corrugated paperboard in sheets and rolls, lined and unlined is classified under industry code 322211 (Corrugated and solid fiber box manufacturing) as product code 32221105 in series PCU32221132221105 with base date 198003 from 1980 M03 through 2026 M09. Active industry series PCU322212322212 tracks Folding paperboard box manufacturing (not seasonally adjusted, industry code 322212, product code 322212, seasonal code U) with base date 198312 from 1983 M12 through 2026 M09.
Scroll horizontally to view all columns.
| Value chain stage | Industry series focus (PCU hierarchy) | Commodity series focus (WPU hierarchy) | Typical packaging substrate or format |
|---|---|---|---|
| Broad sector aggregate | Paper manufacturing subsector output across mills and converting plants | Pulp, paper, and allied products commodity grouping | Aggregate paper, pulp, paperboard, and converted paper products |
| Primary paperboard mills | Paperboard mill establishments and primary rollstock product lines | Paperboard excluding corrugated sheets and rolls | Unbleached kraft linerboard, bleached paperboard, and recycled boxboard rolls |
| Corrugated converting plants | Corrugated and solid fiber box manufacturing establishments and sheet plants | Corrugated paperboard in sheets and rolls and corrugated shipping containers | Fluted corrugated board sheets and slotted shipping containers |
| Folding carton and retail converting | Folding paperboard box manufacturing establishments | Paper boxes, folding paperboard boxes, and packaging components | Retail folding cartons, foodservice containers, and paperboard packaging components |
Base period mechanics and the base-date illusion
For commodity series WPU0914, historical reference observations stand at 162.3 in 1999 M12 and 197.5 in 2006 M12. Dividing the preliminary M09 reading of 457.355 by the M12 reference reading of 183.5 and multiplying by 100.0 rescales WPU09141105 to 249.24, reflecting cumulative price growth of 149.24% over that span. Although the unadjusted M09 levels of 457.355 for WPU09141105 and 230.019 for WPU09141107 differ by 227.336 points, unbleached kraft paperboard WPU09141107 rose by 130.02% from its 100.0 base, leaving a rescaled spread of 19.22 points.
Reading monthly data, annual averages, and the revision window
For WPU0914, the 2025 annual average (M13) is 353.540, 2026 M01 is 356.681, 2026 M05 is 360.107 (final), and the preliminary months marked P are 2026 M06 at 361.177, 2026 M07 at 365.079, 2026 M08 at 373.729, and 2026 M09 at 379.475. Advancing from the annual average of 353.540 to the preliminary M09 reading of 379.475, the aggregate paperboard price commodity index WPU0914 gained 25.935 index points, or 7.34%. For paperboard mills industry series PCU322130322130, the index is 177.0 in 1999 M12, 218.5 in 2006 M12, 390.928 for the 2025 M13 annual average, 397.030 in 2026 M05 (final), and preliminary P at 398.203 in 2026 M06, 401.184 in 2026 M07, 412.696 in 2026 M08, and 418.078 in 2026 M09. Moving from the annual average of 390.928 to the preliminary M09 reading of 418.078, the paperboard mill industry series PCU322130322130 rose by 27.150 index points, or 6.95%. In an earlier pre-revision reading of WPU091503 (index base 1982=100), July 2026 was 380.246 and August 2026 was 386.156, a difference of 5.910 index points or approximately 1.55% from July to August 2026.
Grade-level price divergence across paperboard substrates
For paperboard excluding corrugated sheets and rolls series WPU091411, the index is 206.7 in 2006 M12, 375.015 for the 2025 M13 annual average, 381.249 in 2026 M05 (final), and preliminary P at 382.158 in 2026 M06, 385.115 in 2026 M07, 396.081 in 2026 M08, and 401.479 in 2026 M09. For commodity recycled paperboard series WPU09141105, the index is 183.5 in 1999 M12, 229.5 in 2006 M12, 420.139 for the 2025 M13 annual average, 432.390 in 2026 M05 (final), and preliminary P at 434.584 in 2026 M06, 445.614 in 2026 M07, 452.678 in 2026 M08, and 457.355 in 2026 M09. Climbing from the annual average of 420.139 to the preliminary M09 reading of 457.355, the recycled paperboard commodity index WPU09141105 increased by 37.216 index points, or 8.86%. For commodity unbleached kraft paperboard series WPU09141107, the index is 100.0 in 1999 M12, 123.4 in 2006 M12, 219.722 for the 2025 M13 annual average, 217.129 in 2026 M05 (final), and preliminary P at 217.608 in 2026 M06, 218.240 in 2026 M07, 228.605 in 2026 M08, and 230.019 in 2026 M09. Rising from the annual average of 219.722 to the preliminary M09 reading of 230.019, the unbleached kraft paperboard commodity index WPU09141107 advanced by 10.297 index points, or 4.69%.
For industry recycled paperboard product series PCU3221303221307, the index is 183.5 in 1999 M12, 229.5 in 2006 M12, 426.906 for the 2025 M13 annual average, 439.354 in 2026 M05 (final), and preliminary P at 441.583 in 2026 M06, 452.791 in 2026 M07, 459.970 in 2026 M08, and 464.722 in 2026 M09. Increasing from the annual average of 426.906 to the preliminary M09 level of 464.722, the recycled paperboard industry product index PCU3221303221307 also recorded an 8.86% gain. For industry unbleached kraft paperboard product series PCU3221303221301, the index is 163.8 in 1999 M12, 202.2 in 2006 M12, 358.528 for the 2025 M13 annual average, 354.298 in 2026 M05 (final), and preliminary P at 355.079 in 2026 M06, 356.110 in 2026 M07, 373.024 in 2026 M08, and 375.330 in 2026 M09. Measured against the annual average of 358.528, the unbleached kraft paperboard industry product series PCU3221303221301 dipped by 1.18% to 354.298 at the final M05 reading before rebounding to 375.330 at M09, a cumulative 4.69% increase. Analysts comparing these mill-level series against physical board specifications can cross-reference paper and packaging board grades and pricing to match each furnish category with its end-use converting applications.
Downstream converting pass-through: corrugated boxes vs folding cartons
For corrugated and solid fiber box manufacturing industry series PCU322211322211, the index is 229.9 in 2006 M12, 459.033 for the 2025 M13 annual average, 474.653 in 2026 M05 (final), and preliminary P at 481.444 in 2026 M06, 491.187 in 2026 M07, 501.142 in 2026 M08, and 506.129 in 2026 M09. For corrugated paperboard sheets and rolls product series PCU32221132221105, the index is 218.9 in 2006 M12, 389.173 for the 2025 M13 annual average, 399.836 in 2026 M05 (final), and preliminary P at 402.073 in 2026 M06, 411.916 in 2026 M07, 413.035 in 2026 M08, and 422.632 in 2026 M09. Between the annual average and preliminary M09, corrugated and solid fiber box manufacturing series PCU322211322211 rose by 10.26% from 459.033 to 506.129, while corrugated board sheet series PCU32221132221105 rose by 8.60% from 389.173 to 422.632.
For corrugated paperboard in sheets and rolls series WPU091405, the index is 198.5 in 2006 M12, 352.037 for the 2025 M13 annual average, 361.682 in 2026 M05 (final), and preliminary P at 363.706 in 2026 M06, 372.610 in 2026 M07, 373.622 in 2026 M08, and 382.303 in 2026 M09. For paper boxes and containers series WPU091503, the index is 195.6 in 2006 M12, 366.221 in 2025 M13, 369.583 in 2026 M05 (final), and preliminary P at 373.544 in 2026 M06, 379.801 in 2026 M07, 385.963 in 2026 M08, and 388.196 in 2026 M09. Over the same comparison window, commodity corrugated paperboard in sheets and rolls WPU091405 increased by 8.60% from 352.037 to 382.303, whereas paper boxes and containers WPU091503 increased by 6.00% from 366.221 to 388.196.
For folding paperboard box manufacturing industry series PCU322212322212, the index is 146.6 in 2006 M12, 246.481 for the 2025 M13 annual average, 232.995 in 2026 M05 (final), and preliminary P at 234.077 in 2026 M06, 236.289 in 2026 M07, 237.108 in 2026 M08, and 237.893 in 2026 M09. By contrast, folding paperboard box manufacturing series PCU322212322212 declined by 5.47% from its annual average of 246.481 to 232.995 at M05 and remained 3.48% below that annual average at the preliminary M09 reading of 237.893. For folding paperboard boxes commodity series WPU09150336, the index is 100.0 in 2006 M12, 164.299 in 2025 M13, 155.084 in 2026 M05 (final), and preliminary P at 155.833 in 2026 M06, 157.364 in 2026 M07, 157.934 in 2026 M08, and 158.477 in 2026 M09. Similarly, folding paperboard boxes commodity series WPU09150336 contracted by 5.61% from its annual average of 164.299 to 155.084 at M05 and stood 3.54% below that annual benchmark at the preliminary M09 reading of 158.477. Those divergent trajectories between rising corrugated shipping container prices and softer folding carton realizations illustrate why analysts distinguish packaging companies and machinery builders and US packaging company revenue metrics when modeling equipment demand across shipping and consumer carton lines.
Comparing paperboard and plastic packaging cost trajectories across substrates
For plastic packaging products commodity series WPU072A, the index is 100.0 in 2006 M12, 147.518 for the 2025 M13 annual average, 152.246 in 2026 M05 (final), and preliminary P at 157.509 in 2026 M06, 158.403 in 2026 M07, 156.585 in 2026 M08, and 155.850 in 2026 M09. Measured from the annual average of 147.518, plastic packaging products series WPU072A rose by 7.38% to reach 158.403 at M07 before easing to 155.850 at M09, a net 5.65% advance. Rescaling WPU0914 from its M12 reference reading of 197.5 to the preliminary M09 reading of 379.475 yields a common-base index of 192.14, representing 92.14% cumulative appreciation compared with 55.85% for WPU072A from 100.0 to 155.850.
Contract escalation clauses and financial statement cost bridges
Under federal acquisition rule 16.203-1 (3), adjustments based on cost indexes of labor or material are based on increases or decreases in labor or material cost standards or indexes that are specifically identified in the contract. In establishing the base level from which adjustment will be made, the contracting officer shall ensure that contingency allowances are not duplicated by inclusion in both the base price and the adjustment requested by the contractor under an economic price adjustment clause. Under FAR 16.203-4(d)(1), a clause providing adjustment based on cost indexes of labor or materials may be appropriate when (i) the contract involves an extended period of performance with significant costs to be incurred beyond 1 year after performance begins; (ii) the contract amount subject to adjustment is substantial; and (iii) the economic variables for labor and materials are too unstable to permit a reasonable division of risk between the Government and the contractor, without this type of clause. For paper manufacturing subsector series PCU322—322—, the index is 114.3 in 2006 M12, 190.327 for the 2025 M13 annual average, 195.006 in 2026 M05 (final), and preliminary P at 196.507 in 2026 M06, 198.696 in 2026 M07, 201.319 in 2026 M08, and 202.525 in 2026 M09. Relative to the 375.015 annual benchmark, paperboard excluding corrugated board series WPU091411 shows a 1.66% adjustment at the locked M05 reading of 381.249 versus a 7.06% adjustment at the preliminary M09 reading of 401.479.
Scroll horizontally to view all columns.
| Escalation design parameter | Common contracting or modeling pitfall | Verification protocol using official BLS PPI data |
|---|---|---|
| Series identifier specificity | Naming a generic paperboard index without specifying commodity or industry code | Record the exact alphanumeric series code, title, and index base period in the agreement |
| Seasonal adjustment selection | Referencing discontinued seasonally adjusted paperboard series | Specify active unadjusted series codes that match the exact published product table |
| Preliminary vs final lock window | Triggering price resets on first-published preliminary monthly observations | Require finalized observations after the four-month revision window or define a true-up calculation |
| Non-duplication of contingencies | Embedding inflation contingencies in both the base price and the index clause | Verify that base contract prices exclude duplicate material inflation allowances |
FAQ
What is the difference between PCU and WPU codes in the BLS PPI?
Industry series starting with PCU classify price changes by the NAICS of the producing establishment and measure net output. Commodity series starting with WPU classify products by similarity of end use or material composition, regardless of whether the products are classified as primary or secondary in their industry of origin.
Why does unbleached kraft paperboard have a lower index number than recycled paperboard in the commodity tables?
The two commodity series use different historical index base periods. Comparing raw index point levels confuses the age of the index with the dollar cost per ton; both series must be rescaled to a common reference month before evaluating relative cumulative inflation.
How do preliminary BLS PPI revisions affect packaging supply contracts?
Initial monthly producer price releases are flagged as preliminary and may be revised for up to four months after original publication. Commercial supply agreements and financial cost bridges should specify finalized index readings or define a true-up adjustment when preliminary values are replaced.
How do paperboard price changes flow into packaging company margins?
Primary paperboard mill rollstock prices represent raw material input costs for non-integrated converters and transfer benchmarks for integrated producers, while converted corrugated box and folding carton price series track downstream selling price realization.
Sources
- U.S. Bureau of Labor Statistics, Producer Price Index Commodity and Industry Survey Documentation.
- U.S. Bureau of Labor Statistics, Producer Price Index Commodity Data: Pulp, Paper, and Allied Products and Rubber and Plastic Products.
- U.S. Bureau of Labor Statistics, Producer Price Index Industry Data: Paper Manufacturing Industry Output Series.
- U.S. National Archives and Records Administration, Electronic Code of Federal Regulations, Federal Acquisition Regulation Subpart on Economic Price Adjustment.
Continue the research
Related Research
Segment Reporting in a Packaging Company 10-K: ASC 280 Footnotes, ASU 2023-07 Expenses, and Unallocated Bridges
How to read packaging company Form 10-K segment footnotes under ASC 280 and ASU 2023-07, reconcile CODM profit metrics, and trace intersegment eliminations.
Inventory Turnover for Packaging Converters: Resin Pass-Through Lag, FIFO vs LIFO, and Inventory Days
How to calculate inventory turnover and inventory days for paper, rigid, and flexible packaging converters, normalize LIFO reserves and MRO supplies, and model resin pass-through lags.
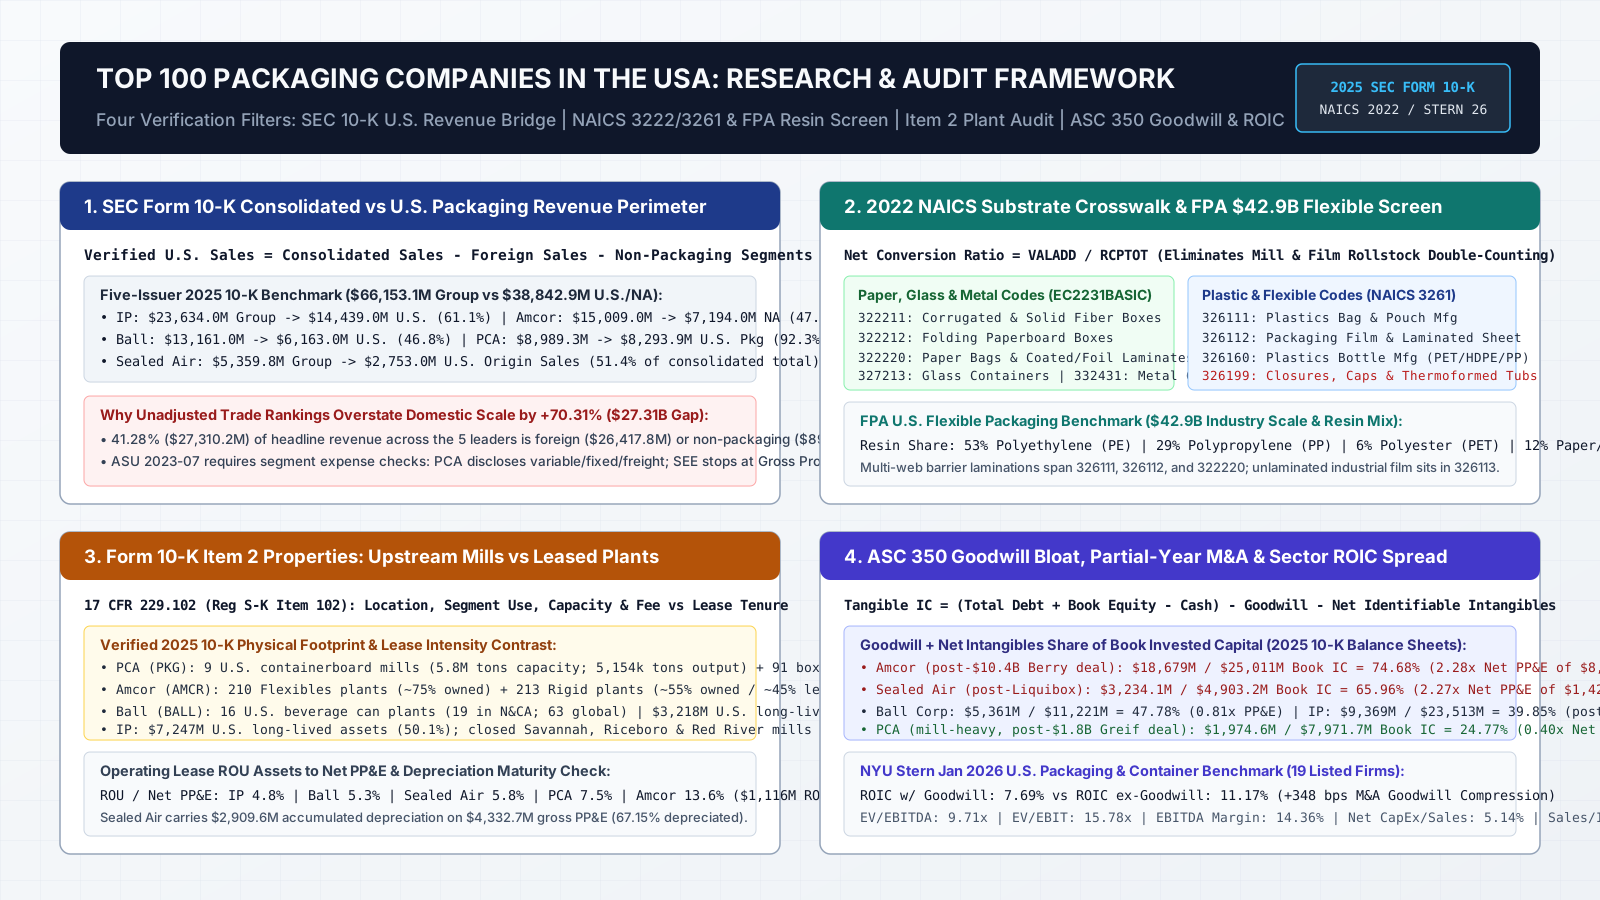
Top 100 packaging companies in the USA: how to audit rankings, plant footprints and M&A goodwill
How can researchers verify rankings of the top 100 packaging companies in the USA by isolating domestic packaging sales, physical plant footprints and acquisition goodwill in SEC filings and Census data?
Sources & Data Notes
- Producer Price Index Commodity and Industry Survey Documentation
- PPI Commodity Data: Pulp, Paper, and Allied Products and Rubber and Plastic Products
- PPI Industry Data: Paper Manufacturing Industry Output Series
- Federal Acquisition Regulation Subpart on Economic Price Adjustment