
Segment Reporting in a Packaging Company 10-K: ASC 280 Footnotes, ASU 2023-07 Expenses, and Unallocated Bridges
Key Takeaways
- Evaluate each packaging issuer's segment note by identifying the Chief Operating Decision Maker and the specific profit metric used to allocate resources before comparing segment margins across peers.
- Separate multi-line significant segment expense disclosures from single-line consolidated expense exceptions when auditing cost structures across containerboard, flexible film, rigid plastic, and metal can producers.
- Subtract intersegment containerboard, paperboard, can component, and freight transfers from aggregate segment revenue so upstream mill output is not double-counted inside external market totals.
- Reconcile reportable segment profit and segment capital spending through unallocated corporate expenses, restructuring charges, intangible amortization, and goodwill impairments to reach consolidated pre-tax income.
Reading segment reporting in a packaging company annual report requires tracing how management disaggregates revenue, manufacturing costs, intercompany substrate transfers, and capital additions inside the audited financial statement footnotes. Because containerboard mills, flexible film extruders, rigid plastic converters, and metal beverage can makers organize their internal reporting around different executive structures, two packaging issuers with identical physical plants can present starkly different segment note tables.
Analysts covering the Packaging Industry use the segment note to connect consolidated financial statements to substrate-level economics. Before comparing divisional margins across issuers, pair the accounting mechanics in this guide with Largest Packaging Companies: Segment Margins and Capital Returns and U.S. Packaging Company Ranking and Research Metrics.
Define operating segments, aggregation rules, and SEC non-GAAP exemptions under ASC 280
Where segment data sits inside an annual filing determines which audit and regulatory rules apply to the numbers. In Form 10-K, Part I Item 1 (‘Business’) describes the company’s main products and markets, Part II Item 7 (‘MD&A’) gives management’s perspective on results, Part II Item 8 contains the audited GAAP financial statements and notes, and the Sarbanes-Oxley Act of 2002 requires CEO and CFO Sections 302 and 906 certifications (in Exhibits 31 and 32). Under 17 CFR § 229.303 (Item 303), where in the registrant’s judgment a discussion of segment information is necessary to an understanding of the business, the discussion must focus on each relevant reportable segment and on the registrant as a whole.
Inside the audited financial statement footnotes, segment reporting follows the management approach codified by the Financial Accounting Standards Board. In November 2023, the FASB issued ASU 2023-07, Segment Reporting (Topic 280), effective for fiscal years beginning after December 15, 2023, and interim periods within fiscal years beginning after December 15, 2024. Under ASC 280-10-50-1, an operating segment is a component of an entity that may recognize revenues and incur expenses, has operating results regularly reviewed by the CODM, and has discrete financial information available. Under ASC 280-10-50-9, when the CODM regularly reviews both product or service line results and geographic results, the set of components based on product and service lines (rather than geography) constitutes the operating segments.
Once operating segments are identified, packaging companies evaluate whether multiple operating units can be combined and which units meet quantitative reporting thresholds. Under ASC 280-10-50-11, operating segments can be aggregated if consistent with ASC 280, if they have similar economic characteristics (such as similar long-term average gross margins), and if they are similar in products, production processes, customers, distribution, and regulatory environment. Under ASC 280-10-50-12 (the 10% tests), an operating segment is reportable if its reported revenue, including both sales to external customers and intersegment sales or transfers, is 10% or more of the combined revenue of all operating segments; if the absolute amount of its reported profit or loss is 10% or more of the greater, in absolute amount, of the combined reported profit of all operating segments that did not report a loss or the combined reported loss of all operating segments that did report a loss; or if its assets are 10% or more of the combined assets of all operating segments. Reportable segments must constitute at least 75% of total consolidated revenue, and while there is no explicit limit on the number of reportable segments, an entity may consider a practical limit of 10, combining remaining operating segments in an ‘all other’ category.
Mandatory footnote disclosures govern both the narrative identification of the chief operating decision maker and the tabular line items required for each reportable segment. Under ASC 280-10-50-21, a public entity shall disclose the factors used to identify reportable segments (including whether operating segments have been aggregated), the types of products and services, and the title and position of the individual or name of the group or committee identified as the CODM. Under ASC 280-10-50-22, a public entity shall report a measure of profit or loss and total assets for each reportable segment and disclose external revenues, intersegment revenues, interest revenue and expense, depreciation, depletion, and amortization expense, equity method income, and income tax expense if included in segment profit or regularly provided to the CODM.
Reconciliation and entity-wide rules link the segment footnote back to the consolidated financial statements and geographic footprint. Under ASC 280-10-50-29 and ASC 280-10-50-30, a public entity shall disclose the basis of accounting for intersegment transactions, any asymmetrical allocations, how the CODM uses each segment profit measure, and reconciliations of reportable segment revenues, profit or loss (to consolidated income before income taxes and discontinued operations), and assets to consolidated totals. Under ASC 280-10-50-40, ASC 280-10-50-41, and ASC 280-10-50-42, a public entity shall report external customer revenues by product and service group, geographic revenues and long-lived assets for the country of domicile and foreign countries, and major customer disclosures whenever a single external customer amounts to 10 percent or more of revenues.
A frequent point of confusion for equity researchers is why adjusted profit metrics appear inside the audited segment note when non-GAAP measures are normally barred from financial statement footnotes. Under 17 CFR § 229.10 (Item 10), a registrant must not present non-GAAP financial measures on the face of GAAP financial statements or in the accompanying notes, but under paragraph (5) non-GAAP financial measures exclude financial measures required to be disclosed by GAAP. For international packaging peers reporting under International Financial Reporting Standards, a parallel management-approach standard applies. In November 2006 the International Accounting Standards Board issued IFRS 8 Operating Segments to replace IAS 14, requiring an entity whose debt or equity securities are publicly traded to disclose information about its operating segments, products and services, geographical areas, and major customers.
Reconcile CODM segment profit definitions across packaging 10-K filings
Because the management approach requires each issuer to report the exact profit measure reviewed by its own chief operating decision maker, reported segment profit is not standardized across packaging companies. Before screening companies in our Packaging Companies Directory, verify whether an issuer’s segment profit represents GAAP operating income, adjusted operating profit before special items, adjusted EBIT, adjusted EBITDA, or segment gross profit.
Packaging Corporation of America (PCA) identifies its Chief Executive Officer as the CODM under ASC 280-10-50-5 (Topic 280) and measures each segment’s profits and losses on operating profits before non-operating pension income (expense), interest expense, net, and income taxes. For the year ended December 31, 2025, Packaging Corporation of America reconciled total Income from operations of $1,107.0 million to consolidated Income before taxes of $1,027.8 million by deducting Non-operating pension expense of $(0.1) million and Interest expense, net of $(79.1) million, and reported segment Capital expenditures of $779.3 million, $15.4 million, and $34.2 million ($828.9 million total) and Assets of $9,354.8 million, $400.5 million, and $970.2 million ($10,725.5 million total).
For the year ended December 31, 2025, Graphic Packaging Holding Company reported Net Sales of $5,889 million for Americas Paperboard Packaging, $2,208 million for International Paperboard Packaging, and $520 million of third-party paperboard sales in Corporate and Other ($8,617 million total), Income (Loss) from Operations of $818 million, $139 million, and $(153) million ($804 million total), and Capital Spending of $95 million, $94 million, and $733 million in Corporate and Other ($922 million total). Dividing Graphic Packaging Holding Company’s Corporate and Other capital spending of $733 million by total capital spending of $922 million shows that 79.50% of annual capital spending sits inside Corporate and Other.
International Paper Company’s CODM assesses performance and allocates resources for Packaging Solutions North America (PS NA) and Packaging Solutions EMEA (PS EMEA) based on business segment operating profit, defined as earnings (loss) before income taxes and equity earnings (losses), including less than wholly owned subsidiaries and excluding interest expense, net, corporate expenses, net, net special items, and non-operating pension expense. In 2025, International Paper reconciled $336 million of total Business Segment Operating Profit to $(3,368) million of consolidated Loss from continuing operations before income taxes and equity earnings by deducting $372 million Interest Expense, net, $(2) million adjustment for less than wholly owned subsidiaries, $109 million Corporate expenses, net, $3,237 million Net special items, and $(12) million Non-operating pension (income) expense. International Paper’s $3,237 million of unallocated Net special items included a $2.47 billion goodwill impairment charge for PS EMEA, $237 million for DS Smith acquisition transaction costs, $321 million for restructuring charges, and mill closure charges of $125 million (Savannah), $96 million (Riceboro), and $84 million (Red River), partially offset by gains of $46 million and $94 million and a $47 million net charge for other items.
Ball Corporation’s Comparable segment operating earnings in 2025 were $772 million for Beverage packaging, North and Central America, $495 million for Beverage packaging, EMEA, and $327 million for Beverage packaging, South America ($1,594 million Reportable segment comparable operating earnings), reconciled to $1,128 million consolidated Earnings before taxes via $(39) million Other (including $155 million of undistributed corporate expenses, net), $41 million Business consolidation and other activities, $(135) million Amortization of acquired intangibles, $(314) million Interest expense, and $(19) million Debt refinancing and other costs. In Note Z of Crown Holdings, Inc.’s financial statements, Crown reports four reportable segments in 2025, namely Americas Beverage ($5,615 million external sales, $1,030 million segment income), European Beverage ($2,325 million external sales, $334 million segment income), Asia Pacific ($1,096 million external sales, $183 million segment income), and Transit Packaging ($2,026 million external sales, $17 million intersegment sales, $258 million segment income; $11,062 million reportable external sales and $1,805 million reportable segment income), plus Other ($1,303 million external sales, $103 million intersegment sales, $148 million income) and $(169) million Corporate and unallocated items.
For the fiscal year ended June 30, 2025, Amcor plc reconciled Adjusted EBIT of $1,723 million to $650 million of Income before income taxes and equity in (income)/loss of affiliated companies by deducting $(246) million amortization of acquired intangibles, $(16) million hyperinflation impact, $(202) million transaction and integration costs, $(64) million restructuring, $(133) million inventory step-up amortization, $(41) million accelerated merger-related compensation, $(21) million Other, $49 million interest income, $(396) million interest expense, and $(3) million equity in income of affiliates.
In Note 3 of Smurfit Westrock plc’s financial statements, the CODM is the executive management team (comprising the Group Chief Executive Officer and Group Chief Financial Officer), which evaluates three integrated operating and reportable segments (North America; Europe, MEA and APAC; and LATAM) using Segment Adjusted EBITDA, with inter-segment transfers entered into on an arm’s length basis. For the year ended December 31, 2025, Smurfit Westrock plc reconciled Segment Adjusted EBITDA of $5,101 million to $959 million consolidated Income before income taxes via $(162) million Unallocated corporate costs, $(2,550) million Depreciation, depletion and amortization, $(385) million Impairment and restructuring costs, $(120) million Transaction and integration-related expenses associated with the Combination, $(729) million Interest expense, net, $30 million Pension non-service income, $(139) million Share-based compensation expense, $(61) million Other expense, net, and $(26) million Other adjustments.
In Note 6 of Sealed Air Corporation’s financial statements, Sealed Air’s CODM (its CEO) evaluates its two reportable segments (Food and Protective) under FASB ASC Topic 280 and allocates resources based on segment Gross profit, considering monthly budget and forecast-to-actual variances. For the year ended December 31, 2025, Sealed Air Corporation reported Food Net sales of $3,594.7 million, Cost of sales of $2,496.2 million, and Segment Gross profit of $1,098.5 million, and Protective Net sales of $1,765.1 million, Cost of sales of $1,261.2 million, and Segment Gross profit of $503.9 million ($5,359.8 million Consolidated Net sales, $3,757.4 million total segment Cost of sales, and $1,602.4 million total Segment Gross profit). For the year ended December 31, 2025, Sealed Air Corporation reconciled total Segment Gross profit of $1,602.4 million to $725.7 million Operating profit and $476.5 million Earnings before income tax provision and discontinued operations by deducting $5.6 million Other unallocated cost of sales, $744.9 million Selling, general and administrative expenses, $(26.8) million Loss on disposal of long-lived assets and businesses, net, $59.5 million Amortization expense of intangible assets, $39.9 million Restructuring charges, $(218.9) million Interest expense, net, and $(30.3) million Other expense, net.
Scroll horizontally to view all columns.
| Segment profit archetype | Expense scope deducted inside segment profit | Typical reconciliation items held below the segment line | Analytical check before cross-company comparison |
|---|---|---|---|
| Segment gross profit | Direct segment cost of sales | Consolidated selling, general, and administrative expenses, unallocated cost of sales, intangible amortization, restructuring, and net interest | Do not compare segment gross margin directly against peers that deduct divisional selling and administrative overhead inside segment operating income |
| Segment adjusted EBITDA | Segment cost of goods sold and segment selling, general, and administrative expenses excluding depreciation and amortization | Depreciation, depletion, and amortization, unallocated corporate costs, share-based compensation, transaction expenses, impairment, restructuring, and net interest | Subtract segment depreciation and amortization before comparing against EBIT or operating profit peers |
| Adjusted EBIT or comparable segment operating profit | Segment manufacturing, depreciation, and divisional operating expenses | Undistributed corporate expenses, acquired intangible amortization, merger transaction and inventory step-up charges, restructuring, goodwill impairments, and net interest | Check whether general corporate overhead is allocated to segments or held in an unallocated corporate bridge line |
| Segment operating income | Segment variable and fixed operating costs, depreciation, and divisional overhead | Corporate and other operating loss, non-operating pension income or expense, and net interest expense | Inspect Corporate and Other to verify whether shared transportation or upstream mill operations sit outside the converting segments |
Audit ASU 2023-07 significant segment expenses versus consolidated-only exceptions
Expanded segment cost rules require public packaging companies to disclose the significant expense categories regularly provided to their chief operating decision maker. Under ASU 2023-07 and ASC 280-10-50-26A, the significant expense principle requires disclosure for each reportable segment of expense categories regularly provided to the CODM, included within the segment’s reported profit or loss, and determined to be significant by management considering quantitative and qualitative factors. When auditing how raw material and converting costs flow through segment cost of sales, pair these disclosures with Inventory Turnover for Packaging Converters and Paper and Packaging Board Grades and Pricing.
For the year ended December 31, 2025, Packaging Corporation of America’s Packaging segment ($8,293.9 million trade sales) deducted disaggregated Variable costs of $(4,007.3) million, Fixed costs of $(1,902.4) million, Freight of $(843.3) million, and Other segment items of $(415.6) million to reach $1,125.3 million of Income from operations. Dividing Packaging Corporation of America’s Packaging segment operating income of $1,125.3 million by Packaging trade sales of $8,293.9 million yields a segment operating margin of 13.57%. For the year ended December 31, 2025, Packaging Corporation of America’s Paper segment ($615.4 million trade sales) deducted Variable costs of $(338.3) million, Fixed costs of $(80.1) million, Freight of $(66.8) million, and Other segment items of $(0.6) million to reach $129.6 million operating income, while Corporate and Other reported $(382.0) million of Other segment items and $(147.9) million operating loss.
In 2025, International Paper disclosed five significant segment expense lines for Packaging Solutions North America ($10,338 million Cost of products sold, $1,293 million Selling and administrative expenses, $1,724 million Depreciation and amortization, $1,125 million Distribution expenses, $123 million Other segment items) and Packaging Solutions EMEA ($6,225 million, $536 million, $1,020 million, $873 million, and $33 million), yielding Business Segment Operating Profit (Losses) of $572 million and $(236) million ($336 million total). For the year ended December 31, 2025, Smurfit Westrock plc deducted disaggregated Segment cost of goods sold of $(13,711) million (North America), $(8,009) million (Europe, MEA and APAC), and $(1,463) million (LATAM) and Segment SG&A of $(1,868) million, $(1,266) million, and $(165) million ($(26,482) million total segment expenses) to reach $5,101 million Segment Adjusted EBITDA ($2,998 million, $1,618 million, and $485 million).
In Note 21 of Amcor plc’s financial statements (following the Merger with Berry in fiscal year 2025), Amcor’s CODM is its Chief Executive Officer, its measure of profit for Global Flexible Packaging Solutions and Global Rigid Packaging Solutions is Adjusted EBIT, and its CODM uses consolidated expense information and is not regularly provided disaggregated expense information for each reportable segment. For the fiscal year ended June 30, 2025, Amcor plc reported Net sales of $10,872 million for Global Flexible Packaging Solutions and $4,137 million for Global Rigid Packaging Solutions ($15,009 million total), single-line Segment expenses and other of $(9,414) million, $(3,762) million, and $(110) million in Other ($(13,286) million total), and Adjusted EBIT of $1,458 million, $375 million, and $(110) million in Other ($1,723 million total). Ball Corporation states that the difference between reportable segment net sales and comparable operating earnings is comprised of other segment items (including cost of sales, depreciation and amortization, selling, general and administrative, and interest income amounts) because the CODM does not receive or use these amounts at the reportable segment level (only at a consolidated level), and that the company does not disclose total assets by segment as it is not provided to the CODM.
Eliminate mill-to-box and intersegment transfers in vertically integrated packaging companies

Vertically integrated packaging manufacturers transfer containerboard, recycled paperboard, can ends, machinery, and freight services between internal divisions before selling finished boxes, cartons, or cans to external customers. Summing gross segment revenues without subtracting intersegment eliminations double-counts upstream transfers.
For the year ended December 31, 2025, Smurfit Westrock plc reported external net sales of $18,220 million for North America, $10,860 million for Europe, MEA and APAC, and $2,099 million for LATAM ($31,179 million total), plus intersegment net sales of $357 million, $33 million, and $14 million ($404 million total) for $31,583 million aggregate segment net sales. In 2025, International Paper reported Net sales from external customers of $14,987 million for Packaging Solutions North America and $8,450 million for Packaging Solutions EMEA ($23,437 million reportable total), plus Intersegment sales of $188 million and $1 million ($189 million total), $197 million of Other external sales, and $(189) million Elimination of intersegment sales to reach $23,634 million Total net sales.
On September 2, 2025, Packaging Corporation of America completed the Greif Acquisition for $1.8 billion in cash, adding two containerboard mills with approximately 800,000 tons of production capacity and eight sheet feeder and corrugated plants across the United States into its Packaging segment. For the year ended December 31, 2025, Packaging Corporation of America reported Trade sales of $8,293.9 million for Packaging, $615.4 million for Paper, and $80.0 million for Corporate and Other ($8,989.3 million total), plus $154.1 million of Intersegment sales in Corporate and Other (eliminated via $(154.1) million) to equal $8,989.3 million Net sales.
In Sonoco Products Company’s 2025 Form 10-K, Sonoco states that its Industrial Paper Packaging segment uses approximately 56% of the paper it manufactures internally (supported by 19 paper mills with 25 paper machines and 1.8 million tons annual recycled paperboard capacity) and sells the remainder to third parties, and effective January 1, 2024 conducts its recycling operations as a procurement function where no recycling net sales are recorded and the margin reduces Cost of sales. In Note 20 of Sonoco Products Company’s financial statements, intersegment sales are recorded at a market-related transfer price ($22,547 thousand for Consumer Packaging and $121,153 thousand for Industrial Paper Packaging in 2025, with $(148,359) thousand total Elimination of intersegment sales across reportable and All Other businesses to reach $7,518,753 thousand consolidated sales), general corporate expenses are allocated to each reportable segment and All Other, and disaggregated assets by segment are not disclosed since segment assets are not regularly provided to the CODM.
In Note 15 of Graphic Packaging Holding Company’s financial statements, the company allocates internally sourced paperboard margin and corporate costs to its two converting reportable segments (Americas Paperboard Packaging and International Paperboard Packaging), while Corporate and Other includes unallocated corporate costs and the Paperboard Manufacturing operating segment and eliminates intercompany transfers to the paperboard packaging segments. In Note Z of Crown Holdings, Inc.’s financial statements, Crown states that it does not disclose total assets by segment as it is not provided to the CODM, that intercompany profit of $2 million (in 2025) and $13 million (in 2023) was eliminated within segment income of Other, and that two global beverage customers accounted for approximately 12% and 11% of consolidated net sales in 2025.
Inter-plant duplication also explains why consolidated packaging revenues do not match macroeconomic establishment shipment totals or broad association output figures. The U.S. Census Bureau’s Annual Survey of Manufactures (ASM) Methodology states that establishment-level data for cost of materials and value of shipments include varying amounts of duplication, especially at higher levels of aggregation, because the products of one establishment may be the materials of another. According to the Flexible Packaging Association’s (FPA) 2025 State of the U.S. Flexible Packaging Industry Report, the total U.S. flexible packaging industry reached $42.6 billion in sales in 2024 (up from $41.4 billion in 2023 at a 2.9 growth rate), whereas the value-added converter segment (excluding retail shopping bags, consumer storage bags, and trash bags) is estimated at $34.1 billion.
Reconcile segment assets, capital expenditures, and unallocated corporate holdings
Capital allocation analysis requires checking whether a packaging company discloses both segment total assets and segment capital expenditures, omits segment assets because the chief operating decision maker does not review balance sheet assets by segment, or records shared mill capital spending inside Corporate and Other. Under ASC 280-10-50-25 and ASC 280-10-50-26, a public entity shall disclose equity method investments and total expenditures for additions to long-lived assets for each reportable segment, and if no asset information is provided for a reportable segment, that fact and the reason therefore shall be disclosed.
In 2025, International Paper reported segment Assets of $16,498 million for Packaging Solutions North America, $15,439 million for Packaging Solutions EMEA, and $6,027 million for Corporate and other ($37,964 million total), and Capital Expenditures of $1,115 million for Packaging Solutions North America, $573 million for Packaging Solutions EMEA ($1,688 million subtotal), and $169 million for Corporate and other ($1,857 million total). For 2025, Smurfit Westrock plc reported segment Capital expenditures of $1,224 million for North America, $723 million for Europe, MEA and APAC, and $208 million for LATAM ($2,155 million reportable total) plus $37 million Corporate ($2,192 million total), and segment Assets as of December 31, 2025 of $28,597 million, $12,238 million, and $3,652 million ($44,487 million reportable total) plus $670 million Corporate ($45,157 million total).
As of December 31, 2025, Sealed Air Corporation allocated $6,004.9 million of assets to reportable segments ($3,410.2 million Food and $2,594.7 million Protective) while leaving Cash and cash equivalents of $344.0 million, Income tax receivables of $57.3 million, Other receivables of $96.5 million, Deferred taxes of $70.0 million, and Other assets of $440.1 million unallocated to reconcile to $7,012.8 million consolidated Total assets.
For the fiscal year ended June 30, 2025, Amcor plc disclosed capital expenditures for long-lived assets of $391 million for Global Flexible Packaging Solutions, $182 million for Global Rigid Packaging Solutions, and $7 million for Other ($580 million total), and stated that total assets by segment are not disclosed as the CODM does not use total assets by segment to evaluate segment performance or allocate resources and capital.
Scroll horizontally to view all columns.
| Diagnostic audit step | Segment note location | Line items to verify | Analytical normalization rule |
|---|---|---|---|
| Identify the decision maker and profit definition | Segment footnote introductory policy text | Executive title or committee name and primary segment profit or loss label | Group issuers by profit definition before comparing margins, and never rank segment gross profit or adjusted EBITDA directly against GAAP operating income |
| Strip intersegment substrate and freight transfers | Segment revenue table and elimination rows | External trade sales, intersegment sales, and intercompany profit eliminations | Use external customer sales as the denominator for segment margin and market-share calculations |
| Audit significant segment expense rows | Segment profit and expense disaggregation table | Variable and fixed manufacturing costs, cost of goods sold, freight, distribution, selling and administrative expenses, and other segment items | Check whether plant depreciation and outbound freight sit inside segment cost lines or in the below-the-line reconciliation |
| Reconcile unallocated corporate and special items | Consolidated pre-tax income bridge | Unallocated corporate expenses, acquired intangible amortization, inventory step-up, restructuring, and goodwill impairment charges | Track multi-year restructuring, mill closure charges, and corporate overhead as a share of consolidated revenue |
| Verify segment assets and capital expenditure scope | Segment assets and capital additions tables | Reportable segment assets, corporate assets, segment capital spending, and non-disclosure statements | Check whether upstream paperboard mill capital spending is housed inside Corporate and Other before computing segment capital intensity |
Sources
- Financial Accounting Standards Board, Accounting Standards Codification Topic on Segment Reporting and Accounting Standards Update on Reportable Segment Disclosures
- RSM US LLP, Financial Reporting Insights on Expanded Reportable Segment Disclosures
- BDO USA, Segment Reporting Accounting and Compliance Guidance
- Cornell Law School Legal Information Institute, Code of Federal Regulations on Non-GAAP Financial Measures and Management Discussion and Analysis
- International Accounting Standards Board and IFRS Foundation, Operating Segments Standard
- U.S. Securities and Exchange Commission Office of Investor Education and Advocacy, Investor Bulletin on How to Read a 10-K
- U.S. Census Bureau, Annual Survey of Manufactures Technical Documentation and Methodology
- Flexible Packaging Association and Packaging Impressions, State of the U.S. Flexible Packaging Industry Report
- Packaging Corporation of America, Annual Report and Segment Information Footnotes
- International Paper Company, Annual Report and Business Segment Footnotes
- Amcor plc, Annual Report and Segments Footnotes
- Ball Corporation, Annual Report and Business Segment Information Footnotes
- Sealed Air Corporation, Annual Report and Segments Footnotes
- Smurfit Westrock plc, Annual Report and Segment Information Footnotes
- Graphic Packaging Holding Company, Annual Report and Business Segment Footnotes
- Crown Holdings, Inc., Annual Report and Segment Information Footnotes
- Sonoco Products Company, Annual Report and Segment Reporting Footnotes
Continue the research
Related Research
Largest packaging companies: segment margins and capital returns
How can researchers compare packaging segment profitability without ranking unlike businesses or inventing segment invested capital?
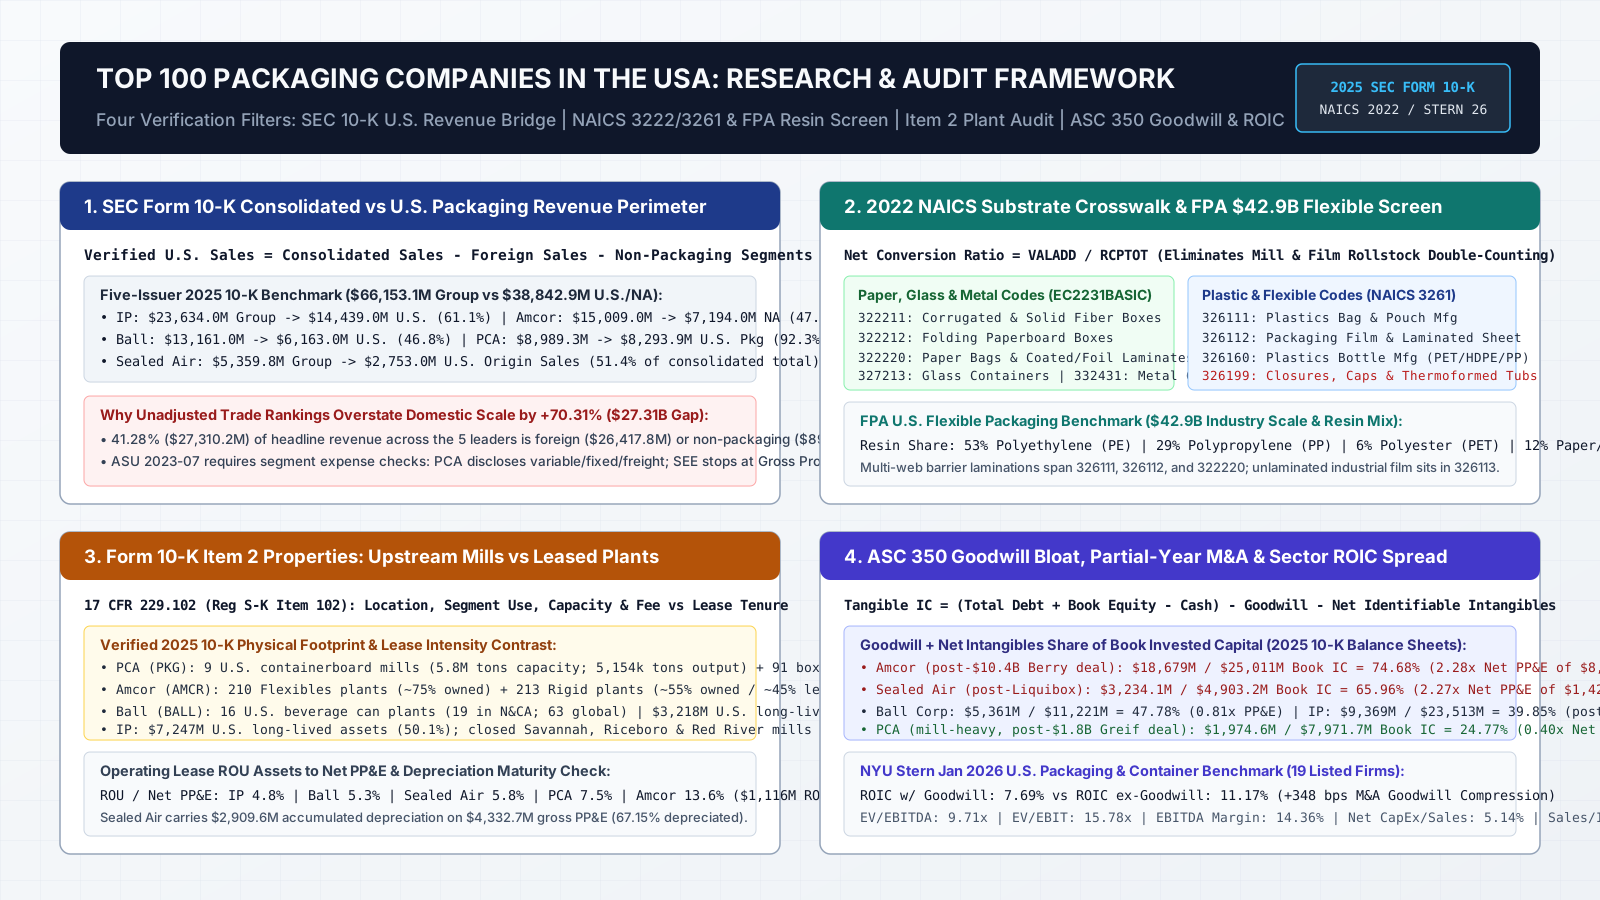
Top 100 packaging companies in the USA: how to audit rankings, plant footprints and M&A goodwill
How can researchers verify rankings of the top 100 packaging companies in the USA by isolating domestic packaging sales, physical plant footprints and acquisition goodwill in SEC filings and Census data?
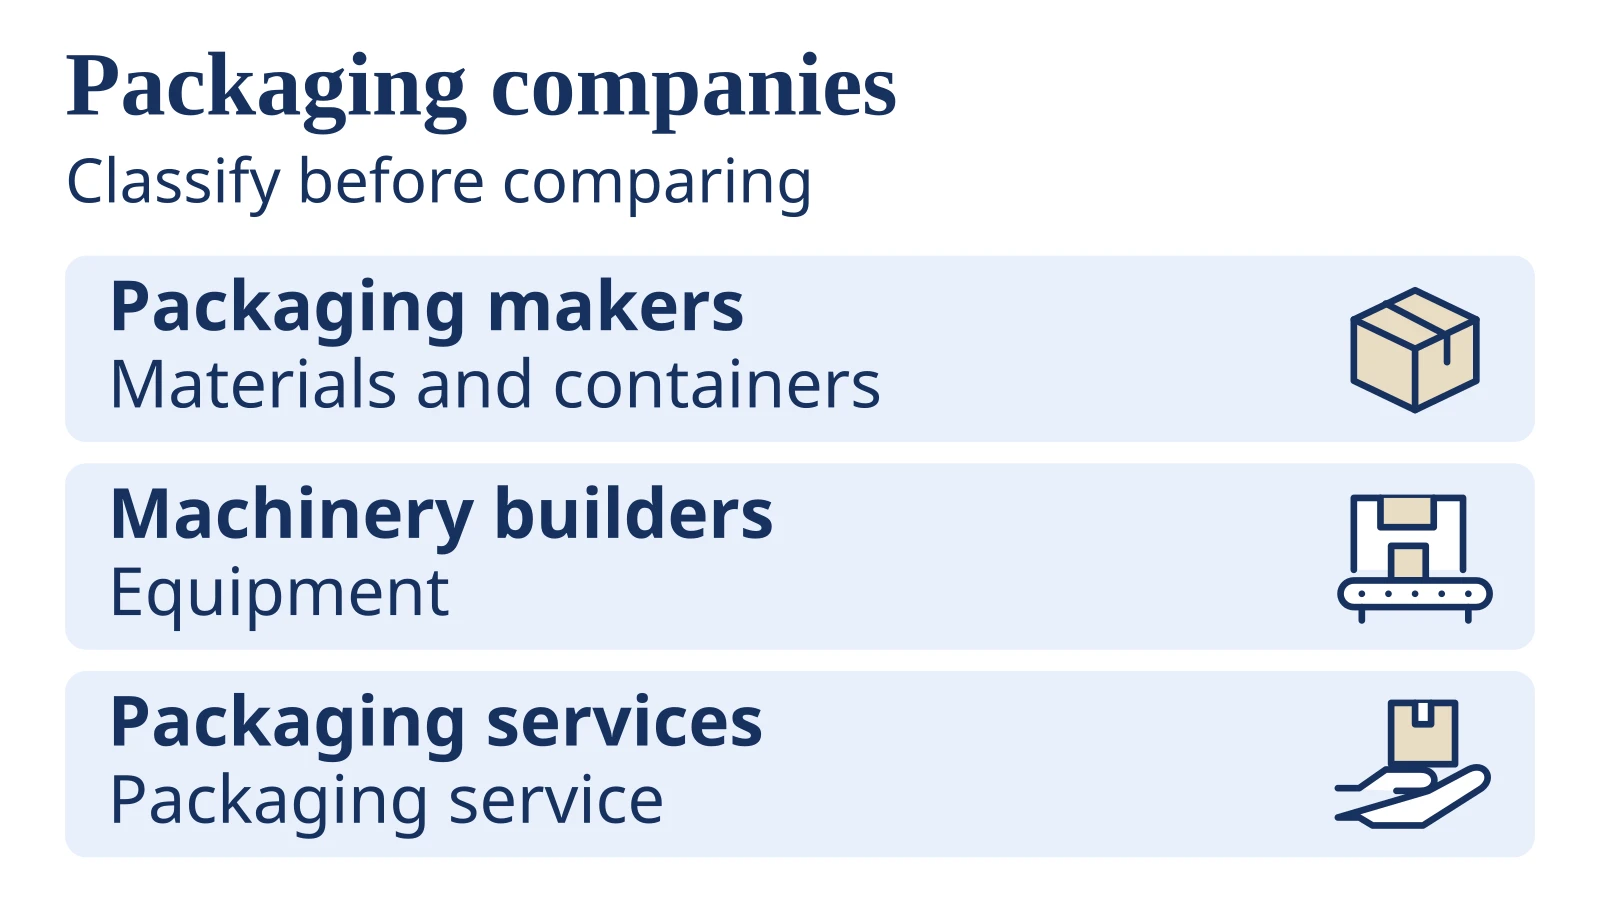
Packaging industry companies: how to compare their businesses
How can readers identify packaging businesses and compare their scale without mixing different revenue, material or geographic boundaries?
Sources & Data Notes
- Segment Reporting Codification and Expanded Reportable Segment Disclosures
- Regulation S-K Item on Non-GAAP Financial Measures and Management Discussion and Analysis
- Operating Segments Standard
- Investor Bulletin: How to Read a 10-K
- Annual Survey of Manufactures Technical Documentation and Methodology
- State of the U.S. Flexible Packaging Industry Report
- Annual Report and Segment Information Footnotes
- Annual Report and Business Segment Footnotes
- Annual Report and Segments Footnotes
- Annual Report and Business Segment Information Footnotes
- Annual Report and Segments Footnotes
- Annual Report and Segment Information Footnotes
- Annual Report and Business Segment Footnotes
- Annual Report and Segment Information Footnotes
- Annual Report and Segment Reporting Footnotes