
Inventory Turnover for Packaging Converters: Resin Pass-Through Lag, FIFO vs LIFO, and Inventory Days
Key Takeaways
- Pair cost of goods sold in the numerator with beginning and ending inventory balances in the denominator before comparing packaging converters across substrates.
- Add back footnote LIFO reserves and strip out mill operating supplies and spare parts so older cost layers and maintenance cribs do not distort converting velocity.
- Track polymer resin, containerboard, and aluminum pass-through timing alongside customer make-and-hold inventory commitments when interpreting quarterly working capital swings.
Evaluating inventory turnover and inventory days for a packaging converter begins with matching the cost of products sold on the income statement to the physical raw materials, work in process, and finished packaging sitting on the balance sheet. The inventory turnover ratio is a common measure of a firm’s operational efficiency in the management of its assets. Unadjusted comparisons across containerboard mills, flexible film extruders, and beverage can makers break down when one converter values parent rolls under last-in, first-out cost layers or bundles heavy mill spare parts inside total inventory while a peer reports resin and film at first-in, first-out cost.
Analysts covering the Packaging Industry can normalize these accounting and operational differences before interpreting working capital changes. A disciplined reading separates active converting stock from maintenance supplies, converts older cost layers to current replacement cost, and checks how raw material pass-through clauses shift inventory carrying values across quarters. For broader context on how receivable, payable, and inventory balances interact across multi-year plant builds, see Working Capital in Industrial Capex Cycles.
Define inventory turnover and inventory days for packaging converters
Under the David W. Wright / University of Michigan Ross School inventory-turnover framework, Inventory Turnover equals Cost of Goods Sold divided by Average Inventory, where Average Inventory is the sum of Beginning Inventory and Ending Inventory divided by 2. An inventory turnover ratio of 4.0 indicates that the company sells through its stock of inventory each quarter, meaning there is a three month supply of inventory on hand. The inventory turnover ratio can be inverted and multiplied by 360 to estimate the number of days sales sitting in inventory, so Days Sales in Inventory equals Average Inventory divided by Cost of Goods Sold multiplied by 360, or 360 divided by Inventory Turnover.
Two common analytical errors distort inventory turnover comparisons: utilizing Sales Revenue rather than Cost of Goods Sold in the numerator, and failing to account for the off-balance sheet LIFO Reserve in the denominator. Because inventory is carried on the balance sheet at cost rather than retail selling price, including Sales Revenue in the numerator overstates the true number of units turned in the period by picking up the irrelevant impact of the firm’s gross margin percentage. When a company uses last-in, first-out accounting, raw balance sheet inventory numbers can be severely understated because of the use of very old costs in their measurement.
In the Olin Corporation example in the Wright/UMich materials, dividing Sales of 3,151.8 by unadjusted Ending Inventory of 263.3 produces an apparent Inventory Turnover ratio of 11.97. Adding the off-balance sheet LIFO reserve of 426.7 to the Ending Inventory of 263.3 yields a FIFO-adjusted ending inventory of 690.0. Replacing Sales with Cost of Goods Sold of 2,823.0 in the numerator and using Ending Inventory of 263.3 plus the LIFO Reserve of 426.7 in the denominator reduces Inventory Turnover to 4.09.
Disaggregate inventory by stage of fabrication and MRO supplies
Before computing turnover for a packaging manufacturer, inspect the inventory footnote to verify which physical classes sit inside the balance sheet line item. Under 17 CFR 210.5-02(6)(a), SEC Regulation S-X requires commercial and industrial companies to state separately on the balance sheet or in a note thereto the major classes of inventory: (1) Finished goods; (2) inventoried costs relating to long-term contracts or programs; (3) work in process; (4) raw materials; and (5) supplies.
Tax accounting rules draw a sharp line between packaging inputs that enter the product and plant maintenance spares that do not. Under IRS Publication 538, items included in inventory consist of merchandise or stock in trade, raw materials, work in process, finished products, and supplies that physically become a part of the item intended for sale. IRS Publication 538 states that supplies that do not physically become part of the item intended for sale are excluded from inventory.
Macroeconomic datasets also model fabrication stages separately when plant-level detail is missing from survey responses. In the U.S. Census Bureau Manufacturers’ Shipments, Inventories, and Orders (M3) survey methodology, initial estimates are made for each of the stages of fabrication at the three-digit NAICS level because some reporting companies report total inventories but cannot report inventories by stage of fabrication. Seasonal modeling for the M3 survey uses the Census Bureau’s X-13ARIMA-SEATS program, and inventory by stage of fabrication is adjusted at the three-digit NAICS subsector level.
Separate operating stock from MRO supplies and spare parts
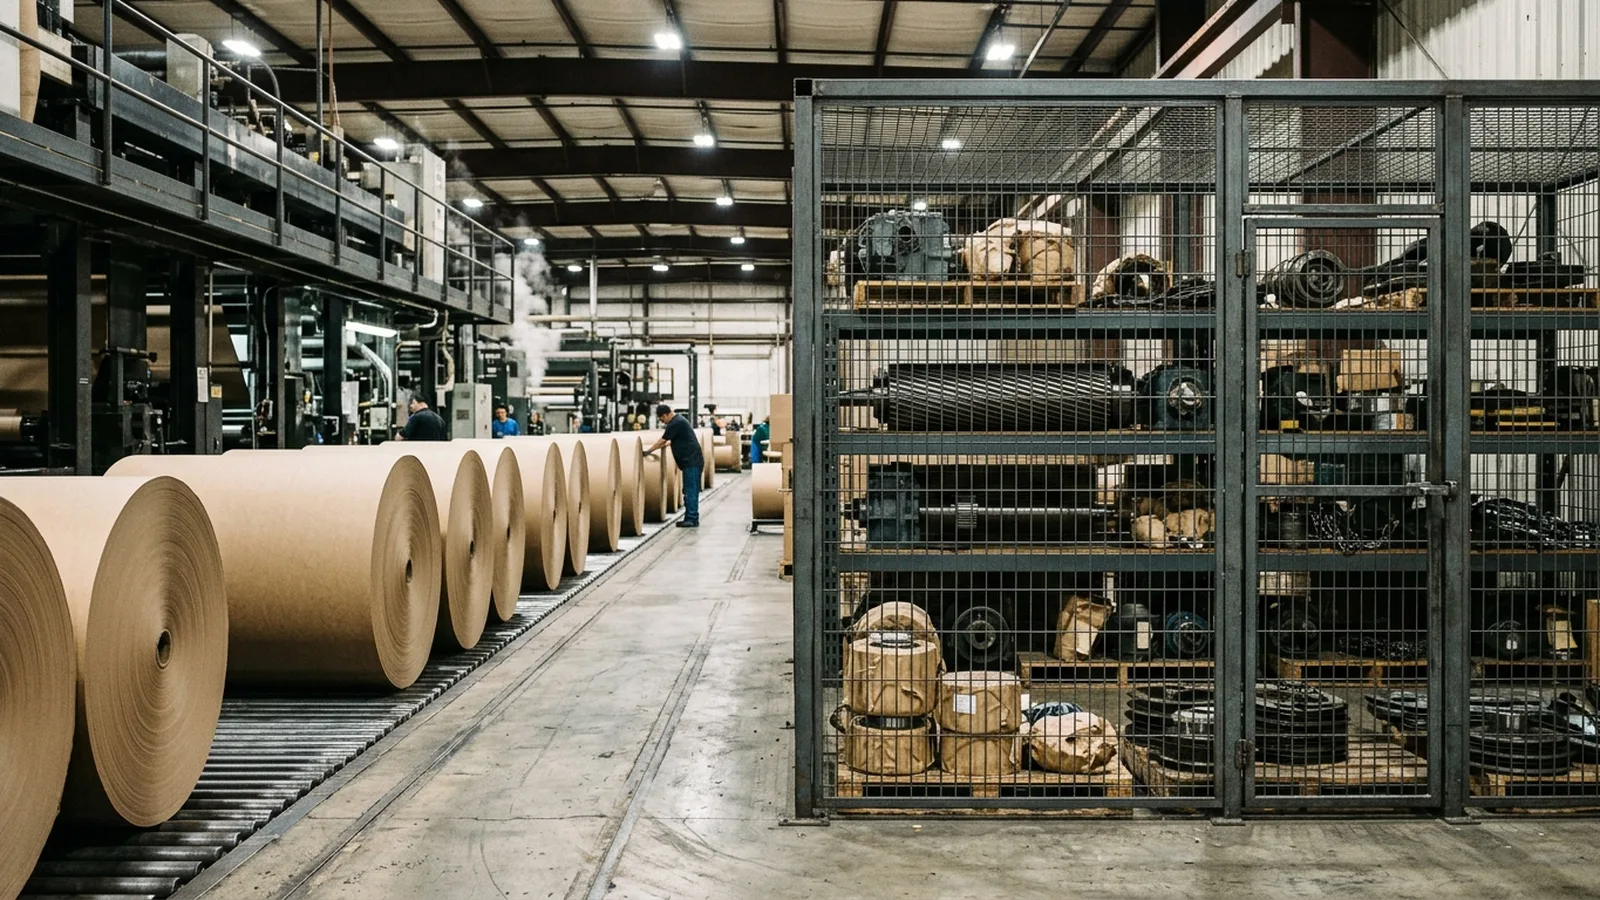
Packaging Corporation of America and International Paper hold substantial balances of supplies and materials or operating supplies alongside raw materials and finished packaging products. Because those maintenance supplies do not become part of shipped corrugated boxes, leaving them in the denominator makes converting stock appear to turn much more slowly than it actually does. Examining the grade structure discussed in Paper and Packaging Board Grades and Pricing helps clarify which roll stocks represent active converting material versus mill equipment spares.
Packaging Corporation of America (PCA) illustrates the magnitude of maintenance and operating supplies on an integrated containerboard balance sheet. For the years ended December 31, Packaging Corporation of America reported Net sales of $8,989.3 million in 2025 ($8,383.3 million in 2024; $7,802.4 million in 2023) and Cost of sales of $7,099.7 million in 2025 ($6,600.2 million in 2024; $6,103.5 million in 2023). Packaging Corporation of America values raw materials, work in process, and finished goods inventories using lower of cost, as determined by the average cost method, or net realizable value, and values supplies and materials using the first-in, first-out (FIFO) or average cost method.
At December 31, 2025, Packaging Corporation of America reported total Inventories of $1,243.2 million ($1,124.9 million at December 31, 2024), consisting of Raw materials of $416.6 million ($356.6 million in 2024), Work in process of $17.5 million ($15.5 million in 2024), Finished goods of $241.6 million ($234.0 million in 2024), and Supplies and materials of $567.5 million ($518.8 million in 2024). Supplies and materials of $567.5 million accounted for 45.65% of Packaging Corporation of America’s total inventories of $1,243.2 million at December 31, 2025, and $518.8 million accounted for 46.12% of total inventories of $1,124.9 million at December 31, 2024.
Using total ending inventories of $1,243.2 million in 2025 and $1,124.9 million in 2024 yields an average total inventory of $1,184.05 million for Packaging Corporation of America in 2025. Dividing 2025 Cost of sales of $7,099.7 million by average total inventory of $1,184.05 million produces an unadjusted inventory turnover ratio of 6.00x, or 60.04 days on a 360-day basis. Subtracting Supplies and materials leaves active converting inventory (raw materials, work in process, and finished goods) of $675.7 million at December 31, 2025 ($1,243.2 million minus $567.5 million) and $606.1 million at December 31, 2024 ($1,124.9 million minus $518.8 million), for an average active converting inventory of $640.9 million. Dividing 2025 Cost of sales of $7,099.7 million by average active converting inventory of $640.9 million raises Packaging Corporation of America’s converting inventory turnover to 11.08x and cuts inventory days to 32.50 days on a 360-day basis.
International Paper Company exhibits a similar concentration of operating supplies in its footnote breakdown. For the years ended December 31, International Paper reported Cost of products sold (exclusive of depreciation and amortization) of $16,637 million in 2025 ($11,397 million in 2024; $11,512 million in 2023) and Depreciation and amortization of $2,747 million in 2025 ($851 million in 2024; $1,146 million in 2023). International Paper’s total Inventories at December 31, 2025 were $2,012 million ($1,486 million at December 31, 2024), broken down into Raw materials of $447 million ($160 million in 2024), Finished packaging products of $792 million ($767 million in 2024), Operating supplies of $691 million ($529 million in 2024), and Other inventories of $82 million ($30 million in 2024). Operating supplies of $691 million represented 34.34% of International Paper’s total inventories of $2,012 million at December 31, 2025, and $529 million represented 35.60% of total inventories of $1,486 million at December 31, 2024.
Normalize cost flow valuation and reserve balances
When comparing a converter that uses last-in, first-out valuation against a competitor on first-in, first-out or average cost, financial statement rules provide the footnote disclosures needed to put both balance sheets on a common cost basis. Under 17 CFR 210.5-02(6)(a), the amounts of inventory classes may be stated under cost flow assumptions other than LIFO with the excess of such total amount over the aggregate LIFO amount shown as a deduction. Under 17 CFR 210.5-02(6)(b), companies state the method by which amounts are removed from inventory, such as average cost, first-in, first-out, last-in, first-out, or estimated average cost per unit. Under 17 CFR 210.5-02(6)(c), if the LIFO inventory method is used, the excess of replacement or current cost over stated LIFO value shall, if material, be stated.
Tax law explains why companies that elect last-in, first-out for income tax returns also report it on their shareholder balance sheets. Under 26 U.S. Code Section 472(c), a taxpayer using the LIFO method must establish that it has used no procedure other than the LIFO procedure in inventorying such goods to ascertain income, profit, or loss for reports or statements covering the taxable year to shareholders, partners, or other proprietors, or for credit purposes.
The choice between cost flow assumptions directly alters both the numerator and denominator of inventory turnover when raw material costs move. Under IRS Publication 538, the FIFO (first-in, first-out) method assumes the items purchased or produced first are the first items sold, consumed, or otherwise disposed of. In times of inflation, when prices are rising, LIFO will produce a larger cost of goods sold and a lower closing inventory, whereas under FIFO, the cost of goods sold will be lower. Under IRS Publication 538, goods accounted for under the LIFO method and goods on hand or being manufactured for delivery at a fixed price on a firm sales contract must be inventoried at cost.
According to the Tax Foundation, the cumulative benefits of LIFO relative to FIFO are known as the LIFO reserve, and LIFO reserves are not cash balances. According to the Tax Foundation, if inventory turnover is high, the gap between the acquisition cost of the last-in unit of inventory and first-in unit of inventory will be smaller, and the tax benefit of LIFO will also be smaller. Recent academic evidence cited by the Tax Foundation suggests companies will only choose LIFO if the tax benefit exceeds 0.35 percent of the cost of goods sold.
International Paper’s inventory disclosures demonstrate how adding the LIFO reserve normalizes turnover. International Paper determines the costs of raw materials and finished paper products generally using the last-in, first-out method, while valuing other inventories using the first-in, first-out or average cost methods. In International Paper’s inventory footnote, 56% of total raw materials and finished products inventories were valued using the LIFO method, and the last-in, first-out inventory reserve was $327 million at December 31, 2025 and $272 million at December 31, 2024.
On an unadjusted LIFO basis, International Paper’s ending inventories of $2,012 million in 2025 and $1,486 million in 2024 produce an average inventory of $1,749.0 million, which against 2025 Cost of products sold of $16,637 million yields an unadjusted inventory turnover ratio of 9.51x, or 37.85 days on a 360-day basis. Adding the LIFO reserve raises International Paper’s FIFO-equivalent ending inventory to $2,339 million at December 31, 2025 ($2,012 million plus $327 million) and $1,758 million at December 31, 2024 ($1,486 million plus $272 million), resulting in a FIFO-equivalent average inventory of $2,048.5 million. Dividing 2025 Cost of products sold of $16,637 million by the FIFO-equivalent average inventory of $2,048.5 million lowers International Paper’s normalized inventory turnover to 8.12x and raises inventory days to 44.33 days on a 360-day basis.
Resin pass-through lag, board pricing, and cost flow timing across substrates
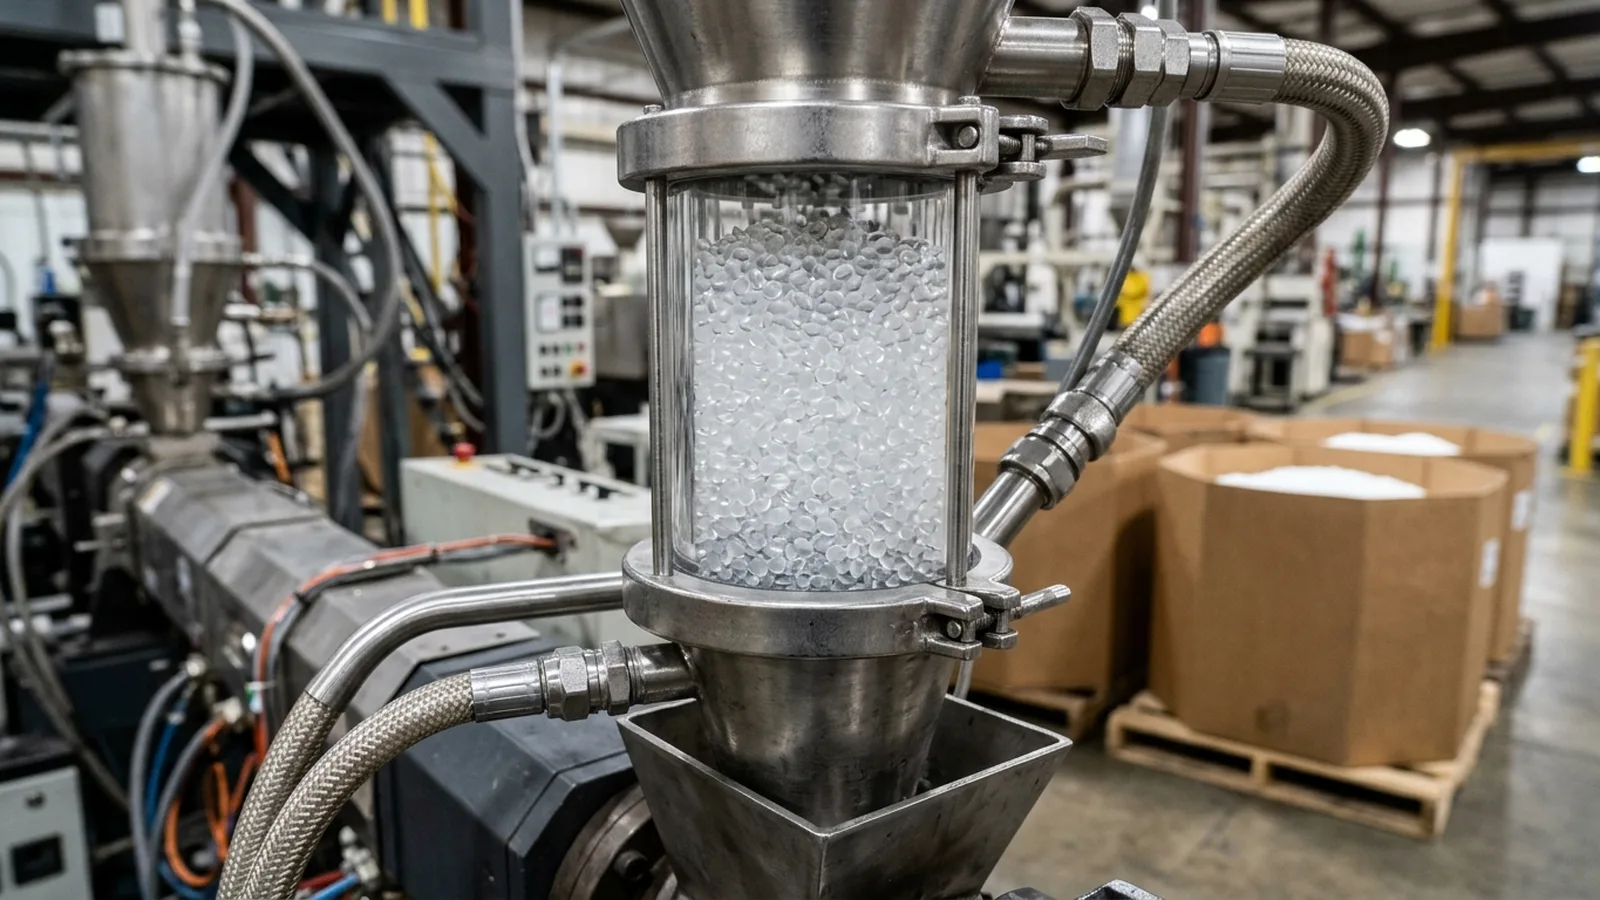
Readers tracking benchmark feedstock series can pair the analysis below with Packaging Costs and Price Indexes.
Official producer price series highlight how plastic resin and corrugated paperboard costs can move in opposite directions over the same period. In the U.S. Bureau of Labor Statistics Producer Price Index for Plastic Resins and Materials (WPU066, index 1982=100), the index moved from 309.985 in May 2026 to 299.249 in June 2026, 283.282 in July 2026, 280.510 in August 2026, and 276.296 in September 2026. Over that May 2026 to September 2026 span, the WPU066 resin index declined by 33.689 points, or 10.87%. In the U.S. Bureau of Labor Statistics Producer Price Index for Paper Boxes and Containers (WPU091503, index 1982=100), the index rose from 369.583 in May 2026 to 373.544 in June 2026, 379.801 in July 2026, 385.963 in August 2026, and 388.196 in September 2026. Across the same May 2026 to September 2026 window, the WPU091503 Paper Boxes and Containers index increased by 18.613 points, or 5.04%.
Amcor plc’s filings detail how resin and film cost pass-through lags interact with working capital in flexible and rigid packaging. Amcor states that polymer resins and films, paper, and linerboard are its primary raw materials, and that increases in the price of raw materials are generally able to be passed on to customers including through contractual price mechanisms over time. Amcor discloses that there may be delays in adjusting prices to correspond with underlying raw material costs and corresponding impacts on its working capital and level of indebtedness. Amcor states that the cost of inventories is based upon the first-in, first-out (“FIFO”) method or average cost method, and that costs related to inventories include raw materials, direct labor, and manufacturing overhead.
For the fiscal years ended June 30, Amcor reported Net sales of $15,009 million in 2025 ($13,640 million in 2024; $14,694 million in 2023) and Cost of sales of $12,175 million in 2025 ($10,928 million in 2024; $11,969 million in 2023). As of June 30, 2025, Amcor’s net inventories consisted of Raw materials and supplies of $1,394 million ($862 million as of June 30, 2024) and Work in process and finished goods of $2,077 million ($1,169 million as of June 30, 2024). Combining those inventory classes gives Amcor total ending net inventories of $3,471 million as of June 30, 2025 ($1,394 million plus $2,077 million) and $2,031 million as of June 30, 2024 ($862 million plus $1,169 million), with an average net inventory of $2,751.0 million. Because Amcor’s ending balance expanded, dividing 2025 Cost of sales of $12,175 million by average net inventory of $2,751.0 million yields an inventory turnover ratio of 4.43x, whereas dividing by ending net inventory of $3,471 million yields 3.51x.
Sealed Air Corporation provides a clean view of petrochemical resin cost changes flowing through a protective and food packaging balance sheet that reports raw materials, work in process, and finished goods separately. Sealed Air states that it uses petrochemical-based raw materials and that raw material pricing, including how its selling prices reflect the cost of raw materials, may negatively impact its results of operations. Sealed Air reported that its cost of sales as a percentage of net sales decreased by 20 basis points from 70.1% in 2023 to 69.9% in 2024, primarily driven by raw material cost deflation, and increased by 30 basis points from 69.9% in 2024 to 70.2% in 2025.
For the years ended December 31, Sealed Air reported Net sales of $5,359.8 million in 2025 ($5,392.6 million in 2024; $5,488.9 million in 2023) and Cost of sales of $3,763.0 million in 2025 ($3,767.5 million in 2024; $3,847.6 million in 2023). Sealed Air reported total net Inventories of $737.0 million at December 31, 2025 (net of inventory reserves of $51.0 million in 2025) and $722.2 million at December 31, 2024 (net of inventory reserves of $45.4 million in 2024) in Note 7. At December 31, 2025, Sealed Air’s net inventories comprised Raw materials of $149.4 million ($157.1 million in 2024), Work in process of $176.9 million ($155.4 million in 2024), and Finished goods of $410.7 million ($409.7 million in 2024), totaling $737.0 million in 2025 and $722.2 million in 2024. Averaging Sealed Air’s 2025 and 2024 ending inventories produces an average net inventory of $729.6 million, which against 2025 Cost of sales of $3,763.0 million results in an inventory turnover ratio of 5.16x and 69.80 inventory days on a 360-day basis.
Ball Corporation illustrates pass-through mechanics in metal beverage packaging. Ball Corporation states that it has provisions in contracts covering the majority of its volumes to pass through aluminum price changes to customers, although there may be timing differences of when the costs are passed through. Ball Corporation states its inventories at the lower of cost or net realizable value using either the first-in, first-out (FIFO) cost method of accounting or the average cost method. For the years ended December 31, Ball Corporation reported Net sales of $13,161 million in 2025 ($11,795 million in 2024; $12,062 million in 2023), Cost of sales (excluding depreciation and amortization) of $10,583 million in 2025 ($9,354 million in 2024; $9,754 million in 2023), and Depreciation and amortization of $622 million in 2025 ($611 million in 2024; $605 million in 2023).
At December 31, 2025, Ball Corporation reported total net Inventories of $2,013 million ($1,477 million at December 31, 2024), consisting of Raw materials and supplies of $1,483 million ($1,089 million in 2024), Finished goods of $619 million ($470 million in 2024), and less Inventory reserves of $89 million ($82 million in 2024). Averaging Ball Corporation’s 2025 and 2024 ending net inventories yields an average inventory of $1,745.0 million, which against 2025 Cost of sales (excluding depreciation and amortization) of $10,583 million produces an inventory turnover ratio of 6.06x and 59.36 inventory days on a 360-day basis.
Seasonality, customer restocking, vendor-managed inventory, and sector benchmarks
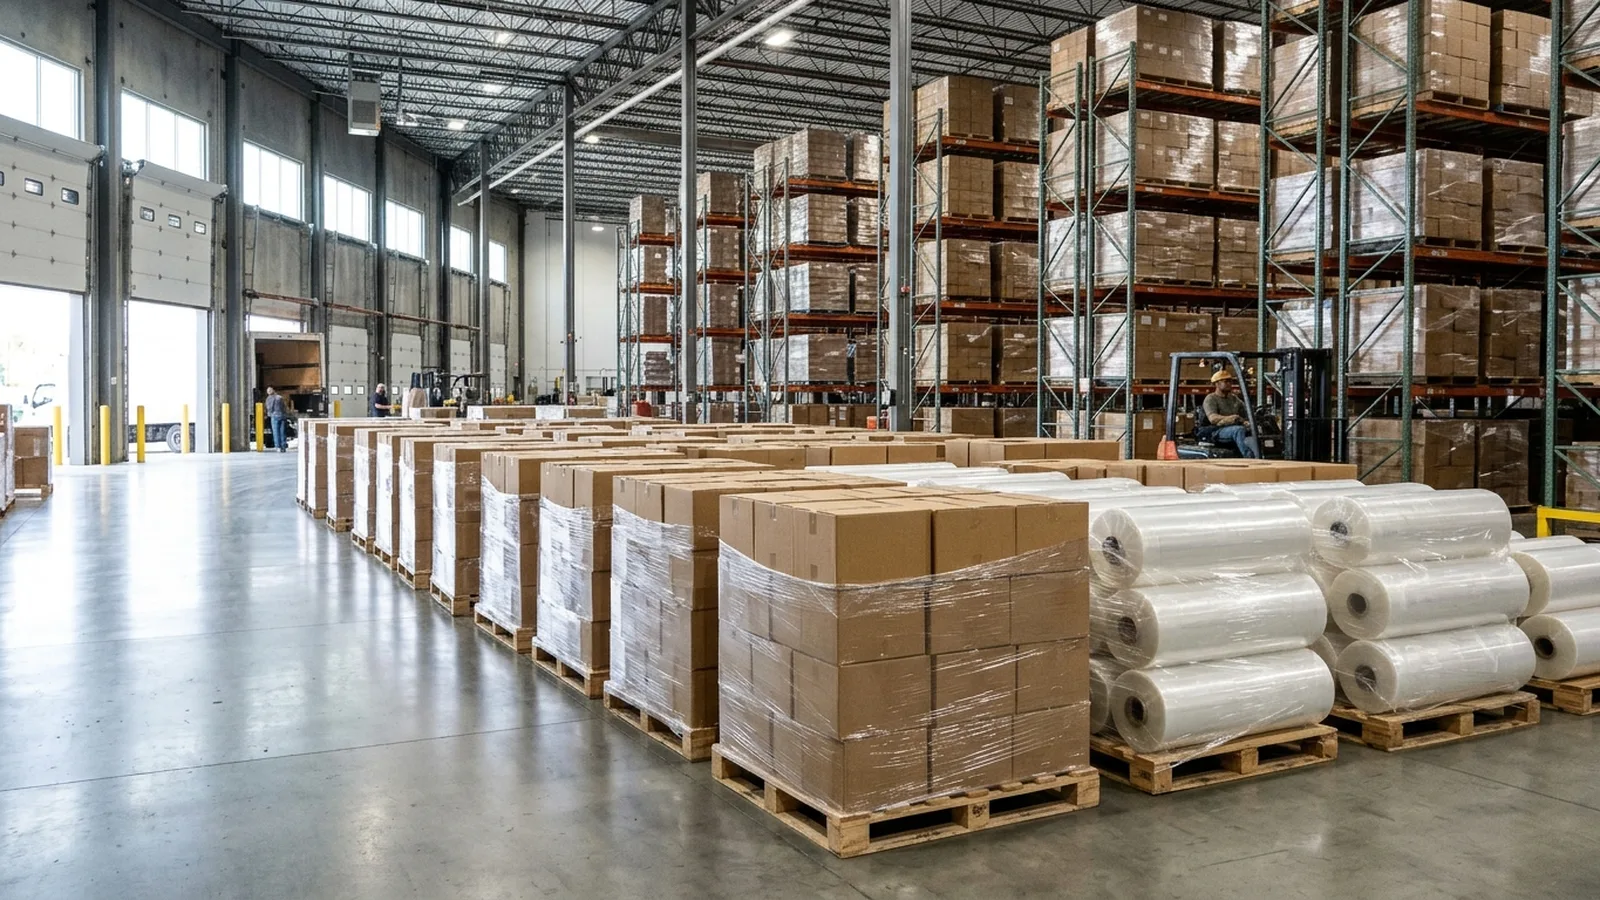
Finished goods turnover in packaging also depends on when legal title transfers under supply contracts, consignment arrangements, and customer inventory-on-hand commitments. Under IRS Publication 538, a business’s inventory includes purchased merchandise if title has passed to the buyer even if the merchandise is in transit, as well as goods out on consignment. Under IRS Publication 538, inventory excludes goods that have been sold once title has passed to the buyer and goods consigned to the business that belong to another owner.
When packaging converters agree to hold buffer stock for downstream food, beverage, or e-commerce accounts, finished goods remain on the converter’s balance sheet until drawn down. In its cash flow discussion, Packaging Corporation of America noted a net favorable change in inventories primarily resulting from a buildup in Packaging segment inventory levels during 2024 due to rising volume and certain customer inventory on hand requirements.
Cross-sector working capital datasets confirm that both packaging converters and paper producers carry a higher share of sales in inventory than the broader non-financial market. In Aswath Damodaran’s NYU Stern Working Capital Ratios dataset as of January 2026, the Packaging & Container sector (19 firms) reported Accounts Receivable to Sales of 15.95%, Inventory to Sales of 13.59%, Accounts Payable to Sales of 16.07%, and Non-cash Working Capital to Sales of 12.66%. In the same NYU Stern dataset as of January 2026, the Paper/Forest Products sector (6 firms) reported Accounts Receivable to Sales of 10.78%, Inventory to Sales of 14.06%, Accounts Payable to Sales of 9.18%, and Non-cash Working Capital to Sales of 13.24%. Across the Total Market without financials (4,822 firms) in Damodaran’s January 2026 dataset, Accounts Receivable to Sales was 12.39%, Inventory to Sales was 8.99%, Accounts Payable to Sales was 11.30%, and Non-cash Working Capital to Sales was 9.30%.
Repeatable SEC filing diagnostic worksheet for packaging converters
Use the worksheet below when pulling annual or quarterly disclosures to normalize inventory turnover and inventory days across paperboard, flexible plastic, rigid plastic, and metal packaging converters.
Scroll horizontally to view all columns.
| Diagnostic step. | Primary filing location. | Line items to extract. | Normalization adjustment. |
|---|---|---|---|
| Align numerator to cost of sales. | Consolidated income statement. | Cost of products sold and any separately stated plant depreciation line. | Use cost of sales rather than net revenue and check whether plant depreciation sits inside or outside cost of sales across peers. |
| Disaggregate inventory classes. | Inventories footnote table. | Raw materials, work in process, finished goods, and operating or maintenance supplies. | Separate active converting stock from maintenance spares and mill operating supplies before computing converting velocity. |
| Convert older cost layers to current cost. | Inventories footnote valuation text. | Stated cost flow method and parenthetical or footnote reserve balance. | Add the beginning and ending reserve balances to stated inventories when comparing a last-in, first-out filer with a first-in, first-out peer. |
| Control for acquisition timing and seasonality. | Balance sheet and cash flow statement. | Quarterly inventory balances and cash flow operating working capital changes. | Average multi-quarter balances when a mid-year merger or seasonal harvest buildup skews the year-end snapshot. |
| Audit pass-through lag and customer buffer stock. | Management discussion and risk factors. | Resin, board, or metal escalator clauses and customer inventory-on-hand commitments. | Track whether rising feedstock indexes or customer make-and-hold programs expanded finished goods carrying values relative to unit volume. |
Continue the research
Related Research
Packaging costs: how to read price indexes
How can researchers track packaging cost pressures without confusing producer selling prices with a manufacturer's total costs?
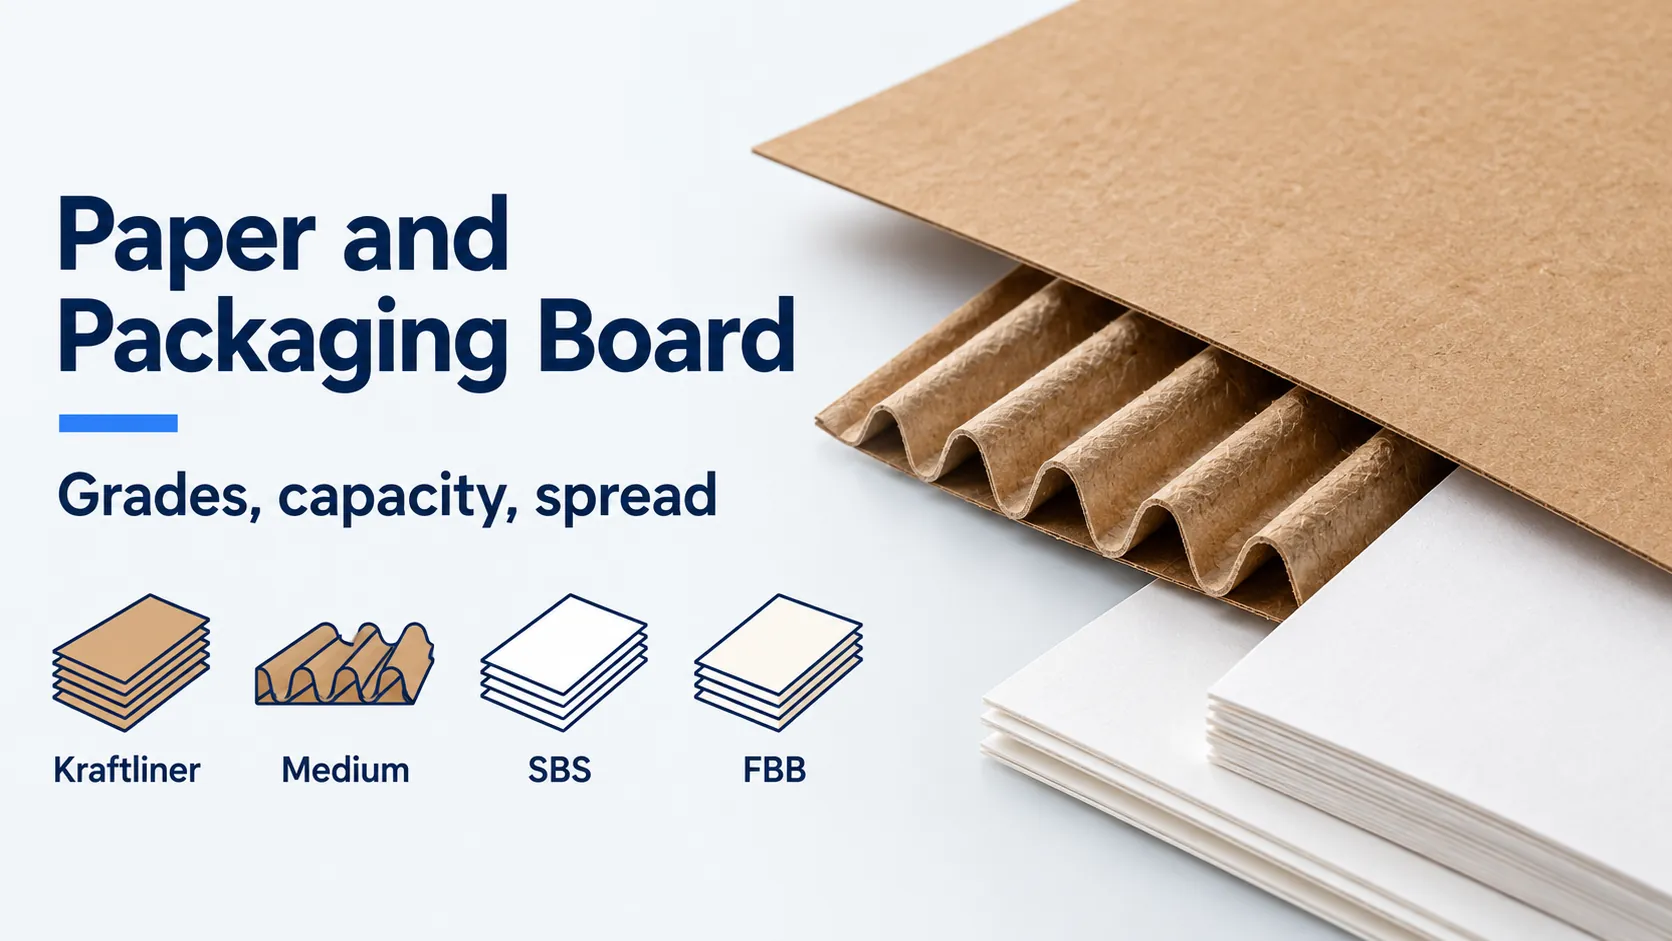
Paper and packaging board: grades, capacity and pricing spreads
How do paperboard grades, capacity denominators and cash-cost boundaries change a per-tonne pricing-spread analysis?
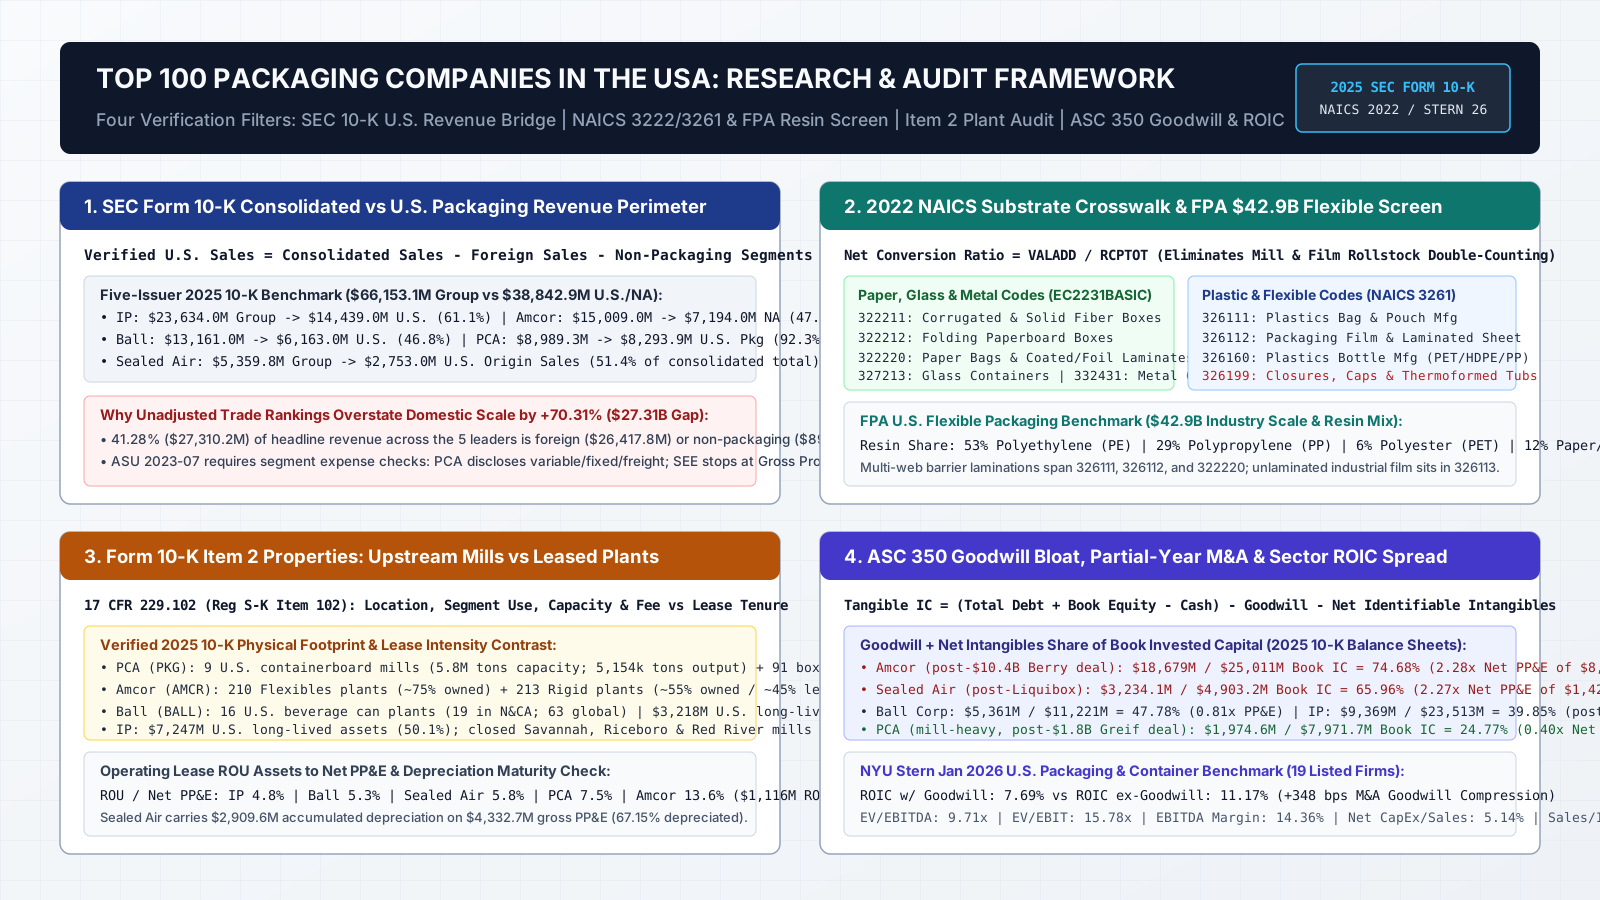
Top 100 packaging companies in the USA: how to audit rankings, plant footprints and M&A goodwill
How can researchers verify rankings of the top 100 packaging companies in the USA by isolating domestic packaging sales, physical plant footprints and acquisition goodwill in SEC filings and Census data?
Sources & Data Notes
- Financial Statement Analysis: Inventory Turnover (David W. Wright / University of Michigan Ross School)
- Regulation S-X: Commercial and Industrial Companies Inventories
- Internal Revenue Code: Last-in, First-out Inventories
- Accounting Periods and Methods
- The Economic Effects of the LIFO Inventory Accounting Method
- Manufacturers' Shipments, Inventories, and Orders Survey Methodology
- Working Capital Ratios by Sector (US)
- Producer Price Index: Plastic Resins and Materials (WPU066)
- Producer Price Index: Paper Boxes and Containers (WPU091503)
- Annual Report and Inventory Footnotes
- Annual Report and Inventory Footnotes
- Annual Report and Inventory Footnotes
- Annual Report and Inventory Footnotes
- Annual Report and Inventory Footnotes