
3-2-1 Crack Spread: Formula, Refinery Margin & Limits
Key Takeaways
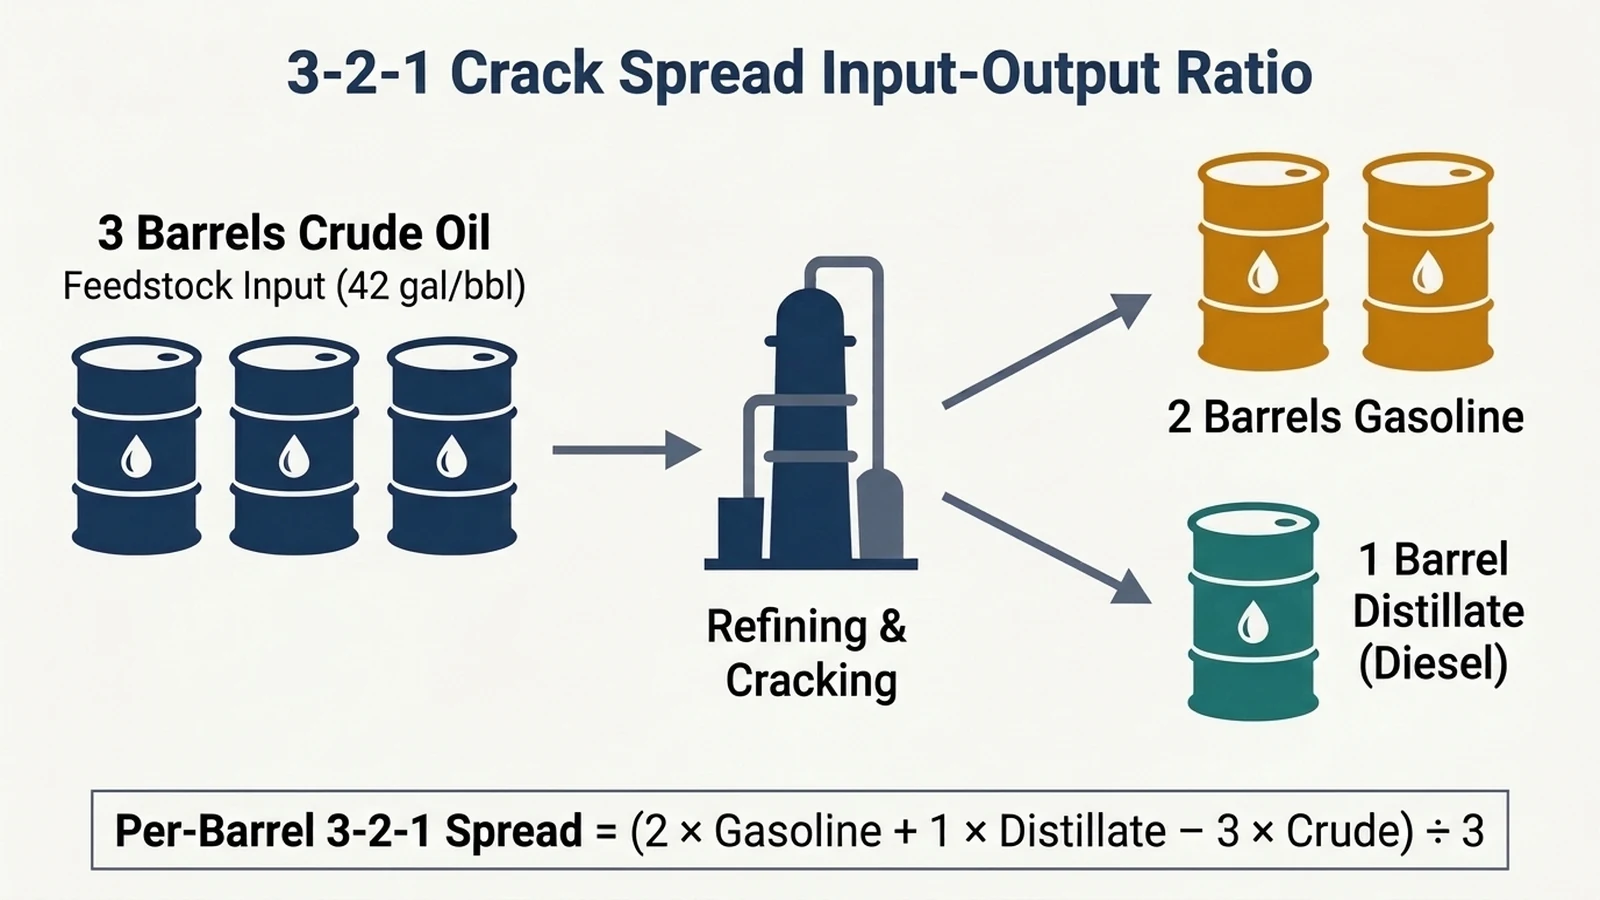
- The 3-2-1 crack spread subtracts 3 barrels of crude oil from 2 barrels of gasoline and 1 barrel of distillate, divided by 3 for a per-barrel margin proxy.
- Wholesale gasoline and diesel futures trade per gallon while crude oil trades per barrel, so fuel quotes are multiplied by 42 gallons per barrel before subtracting.
- A crack spread signals short-run incentives to raise refinery utilization, but excludes non-crude operating costs, co-products, and plant-specific crude slates.
- Benchmark hub choices, fuel specifications, and March 1 or October-to-February seasonal shifts materially change how a crack spread chart behaves.
Research Scope
- Regions
- U.S. petroleum refining benchmarks (Gulf Coast, New York Harbor, and Los Angeles hubs), with global crude and distillate trade context.
- Period
- EIA methodology, 2023 preliminary U.S. refinery yield table, 2024 U.S. distillate export share, and April 2022 Dallas Fed market indicators. No live quotes or margin forecasts.
- Industries
- Petroleum refining, wholesale motor fuels, and downstream energy markets.
- Data objects
- Multi-product crack spread formulas, volumetric unit conversions, refinery yield proportions, and futures contract specifications.
The 3-2-1 crack spread estimates gross petroleum refining margins by subtracting 3 barrels of crude oil from 2 barrels of gasoline and 1 barrel of distillate fuel oil, then dividing by 3 for a per-barrel value. Multiply per-gallon fuel quotes by 42 gallons per barrel before subtracting, and distinguish gross spreads from actual refinery profit.
Within the broader markets research framework, crack spreads sit between globally priced crude oil and regional wholesale fuel markets. Recording the exact unit conversion, contract benchmark, and refinery cost boundary prevents the spread from being misread as reported downstream earnings.
How is the 3-2-1 crack spread formula calculated?
Calculate the 3-2-1 crack spread by adding the per-barrel prices of 2 barrels of gasoline and 1 barrel of distillate fuel oil, subtracting the price of 3 barrels of crude oil, and dividing the basket result by 3 to express the spread per barrel of crude processed.
The U.S. Energy Information Administration (EIA) introduction to crack spreads defines the 3:2:1 crack spread as the difference between 2 barrels of gasoline plus 1 barrel of distillate and 3 barrels of crude oil. That ratio mirrors U.S. refining output, which generally yields roughly 2 barrels of gasoline for every 1 barrel of distillate.
In plain algebraic form, the per-barrel calculation works in two steps:
- Convert wholesale gasoline and distillate prices from per-gallon quotes into per-barrel prices by multiplying each per-gallon price by 42, because one standard U.S. crude oil barrel contains 42 gallons.
- Compute the three-barrel basket value as two times the per-barrel gasoline price plus one times the per-barrel distillate price minus three times the per-barrel crude oil price, then divide that total by 3.
Equivalently, as EIA notes in its petroleum product prices and crack spreads guide, analysts can convert crude oil to a per-gallon value by dividing the per-barrel crude price by 42 and compare every leg on a per-gallon basis. Either unit convention is valid as long as all three legs share the same volume denominator before subtraction.
Avoiding unit-conversion and scaling errors
Two arithmetic mistakes distort spreadsheet calculations. First, subtracting raw per-gallon gasoline or diesel futures quotes directly from per-barrel crude oil prices mixes incompatible units and produces an unusable negative figure. Second, reporting the unscaled three-barrel basket total alongside a per-barrel series triples the apparent margin.
Table 1. Standard legs and unit alignment for a 3-2-1 crack spread calculation. Sources: EIA introduction to crack spreads, EIA product prices guide, and EIA inputs and outputs overview.
Scroll horizontally to view all columns.
| Leg | Basket weight | Typical U.S. quote unit | Conversion to per-barrel basis | Common U.S. futures reference |
|---|---|---|---|---|
| Crude oil input | 3 barrels | Per barrel (42 gallons) | Multiply by 1 (already per barrel) | West Texas Intermediate (WTI) or Brent |
| Gasoline output | 2 barrels | Per gallon | Multiply per-gallon price by 42 | RBOB gasoline blendstock |
| Distillate output | 1 barrel | Per gallon | Multiply per-gallon price by 42 | Ultra-low sulfur diesel (ULSD) |
| Per-barrel 3-2-1 spread | Divided by 3 | Per barrel of crude | Sum product barrels, subtract 3 crude barrels, divide by 3 | Standardized gross margin proxy |
What does the 3-2-1 crack spread mean for refining margins?
The 3-2-1 crack spread indicates the gross wholesale value added by turning crude oil into gasoline and distillate, signaling short-run incentives for refineries to raise capacity utilization rather than measuring actual refinery net profit. Because it omits operating expenses, co-products, and plant-specific crude slates, it remains an industry margin proxy.
As the Federal Reserve Bank of Dallas emphasized in its April 28, 2022 Energy Indicators report, crack spreads do not reflect actual refiner profits, even though they indicate incentives to increase utilization in the short run. EIA similarly notes that crack spreads are simple one- or two-product measures that exclude both other refinery product revenues and all refining costs beyond crude oil.
Why realized refinery earnings diverge from the benchmark spread
Four structural gaps separate a benchmark 3-2-1 quote from a refiner’s income statement:
- Non-crude operating expenses: Refineries consume substantial energy to run separation and conversion units. The Federal Reserve Bank of Dallas highlights natural gas used for heat, electricity, and hydrogen as a major operating expense whose regional price gap creates wide cost differences between U.S. refiners and European or Asian competitors.
- Omitted co-products: A refinery does not sell only gasoline and diesel. Jet fuel, petroleum coke, still gas, hydrocarbon gas liquids, asphalt, and residual fuel oil all contribute to or drag on total revenue depending on local markets.
- Feedstock quality and complexity: Crude oils differ by density (API gravity) and sulfur content. According to EIA’s refining inputs and outputs overview, light crude yields high-value fuels through simple distillation, whereas denser heavy or high-sulfur crude requires additional, more expensive processing units.
- Processing gain: Because most finished petroleum products are less dense than incoming crude oil, total liquid output exceeds crude volume input. U.S. refineries averaged a 6.3% processing gain in 2023, producing roughly 45 gallons of refined products from every 42-gallon barrel of crude oil.
Table 2. Average petroleum products produced from one 42-gallon barrel of oil input at U.S. refineries in 2023 (preliminary data). Source: U.S. Energy Information Administration, Petroleum Supply Monthly, March 2024.
Scroll horizontally to view all columns.
| Refined product | Average output (gallons per 42-gallon barrel) | Included in 3-2-1 crack spread? |
|---|---|---|
| Finished motor gasoline | 19.57 | Yes (2-barrel weighting proxy) |
| Distillate fuel oil | 12.47 | Yes (1-barrel weighting proxy) |
| Kerosene-type jet fuel | 4.41 | No |
| Petroleum coke | 2.06 | No |
| Still gas | 1.68 | No |
| Hydrocarbon gas liquids | 1.55 | No |
| Asphalt and road oil | 0.84 | No |
| Residual fuel oil | 0.71 | No |
| Total refined output (including minor products) | 44.65 | Includes 2.65 gallons processing gain |
Table 2 shows why the 3-2-1 ratio is a practical shorthand rather than a complete revenue model. Even in aggregate U.S. data, finished motor gasoline contributes 19.57 gallons and distillate fuel oil contributes 12.47 gallons out of the 44.65 total output gallons, leaving jet fuel and heavier co-products outside the benchmark calculation. To move from an industry spread indicator to an issuer’s actual downstream earnings and cash flow, consult our guide to oil company profits and capex.
What is crude oil cracking?
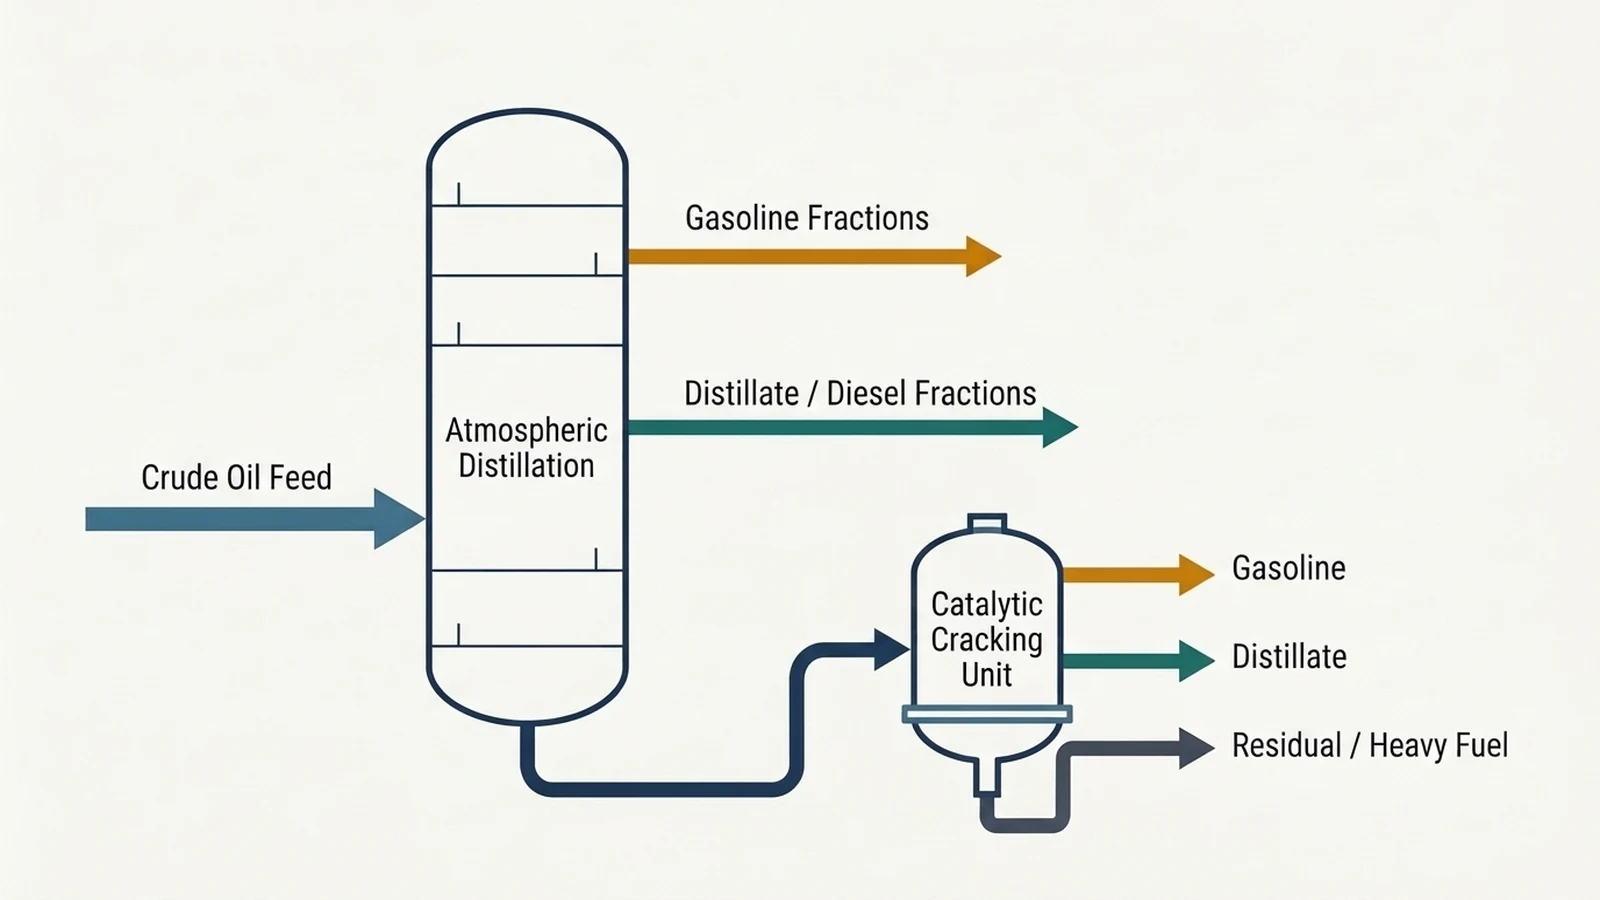
Crude oil cracking is the primary refinery conversion process that uses heat, pressure, catalysts, and sometimes hydrogen to break large, heavy hydrocarbon molecules into lighter, higher-value fuels such as gasoline and diesel. Complex refineries pair catalytic crackers, hydrocrackers, and cokers with distillation towers to upgrade heavy fractions left after separation.
According to EIA’s overview of the refining process, every petroleum refinery follows three basic steps: separation, conversion, and treatment. The term crack spread comes directly from the conversion stage, where complex units upgrade low-value heavy fractions that simple distillation leaves behind.
During separation, crude oil passes through hot furnaces into atmospheric distillation towers (and vacuum distillation towers at more complex plants). Fractions separate by boiling point: the lightest components, including gasoline and liquefied refinery gases, rise to the top; medium-weight liquids, including kerosene and distillates, draw from the middle; and heavier gas oils and residues settle toward the bottom.
During conversion, cracking units split those heavier fractions into lighter blending streams. Different conversion configurations shift a refinery’s economic exposure across the crack spread:
- Catalytic cracking: Defined in the EIA Energy Glossary as breaking larger, heavier, more complex hydrocarbon molecules into simpler, lighter molecules using a catalytic agent, fluid catalytic cracking (FCC) units are typically geared toward higher gasoline yields.
- Catalytic hydrocracking: Uses hydrogen and catalysts at relatively low temperatures and high pressures to convert middle-boiling or residual material into high-octane gasoline, jet fuel, or high-grade fuel oil, and can handle high-sulfur feedstocks without prior desulfurization.
- Coking: As noted by the Federal Reserve Bank of Dallas, cokers break down complex heavier barrel components and tend to improve distillate yields, which can cause implied coker margins to diverge sharply from gasoline-oriented FCC margins when diesel supplies tighten.
Finally, treatment blends intermediate streams to meet octane ratings, vapor pressure limits, and sulfur rules before products enter storage tanks for pipeline, rail, or truck distribution.
How does a 5-3-2 crack spread differ from 3-2-1?
Both 5-3-2 and 3-2-1 follow the standard X:Y:Z crack ratio convention where total crude barrels equal gasoline plus distillate barrels, but a 5-3-2 spread assigns 2 barrels of distillate and 3 barrels of gasoline per 5 barrels of crude compared with 1 barrel of distillate and 2 barrels of gasoline per 3 barrels of crude in a 3-2-1 spread.
EIA identifies 3:2:1 as the most common multi-product benchmark alongside 5:3:2 and 2:1:1, as well as single-product crack spreads that compare one barrel of a single fuel against one barrel of crude oil. As summarized in Wikipedia’s overview of crack spreads (incorporating EIA’s derivatives handbook), refiners and traders select ratios that match regional demand or seasonal fuel slates.
Table 3. Comparison of standard crack spread ratios and implied output weightings. Sources: EIA introduction to crack spreads and EIA derivatives overview via Wikipedia.
Scroll horizontally to view all columns.
| Spread convention | Crude input (barrels) | Gasoline output (barrels) | Distillate output (barrels) | Primary analytical use |
|---|---|---|---|---|
| Single-product crack spread | 1 barrel | 1 barrel (gasoline spread) or none | None or 1 barrel (distillate spread) | Isolates standalone gasoline or diesel refining economics |
| 3-2-1 crack spread | 3 barrels | 2 barrels | 1 barrel | Standard U.S. gasoline-weighted refinery benchmark |
| 5-3-2 crack spread | 5 barrels | 3 barrels | 2 barrels | Higher distillate weighting for diesel-oriented or winter slates |
| 2-1-1 crack spread | 2 barrels | 1 barrel | 1 barrel | Equal gasoline and distillate balance |
Exchange-listed crack bundles versus custom OTC swaps
In futures markets, managing separate crude oil and refined-product positions ties up substantial collateral. To reduce that burden, NYMEX launched an exchange-traded crack spread contract in 1994 that treats the purchase and sale of multiple legs as a single transaction for margin requirements. One standard 3-2-1 bundle pairs 3 crude oil futures (30,000 barrels) with 2 gasoline futures (20,000 barrels) and 1 heating oil future (10,000 barrels).
Because a sweet-crude 3-2-1 futures contract does not fit refineries specialized in heavy crude oil or non-standard fuel slates, over-the-counter (OTC) markets provide customized swaps tailored to plant-level feedstock discounts and product yields.
What drives historical crack spread spikes?
Historical crack spread spikes occur when regional refined-product supply tightens faster than global crude oil supply—typically from low fuel inventories, operable refining capacity losses, unplanned plant outages, or sudden export demand shifts. When product markets tighten while refinery throughput hits physical limits, wholesale fuel prices pull sharply ahead of crude oil.
EIA notes that crude oil is priced in a global marketplace, whereas refined products respond to local specifications, transportation bottlenecks, and seasonal demand. When refining capacity cannot expand quickly to meet fuel consumption, product prices pull ahead of crude prices and widen the crack spread.
The Federal Reserve Bank of Dallas Energy Indicators report of April 28, 2022 documents a clear historical episode of these forces converging:
- Multi-year benchmark highs: Over the four weeks ending April 15, 2022, the U.S. Gulf Coast WTI 3:2:1 crack spread hit its highest reading since September 2008, while the New York Brent 3:2:1 crack spread reached its highest level in over 18 years.
- Tight distillate inventories: At the end of March 2022, U.S. distillate inventories stood at 28.8 days of cover, which was 7.3 days below the five-year average, and April 2022 distillate stocks dropped to their lowest level since mid-May 2008.
- Operable capacity contraction: Entering 2022, U.S. Gulf Coast operable refining capacity declined to roughly 9.6 million barrels per day (mb/d) from 9.9 mb/d in January 2020 and January 2021, while the rest of the United States fell twice as sharply from 8.9 mb/d to 8.3 mb/d as older or uneconomic plants retired or converted into biofuel facilities.
- Export surges and global trade: Amid European supply dislocations, U.S. distillate and jet fuel exports jumped 56.7% from February to 1.3 mb/d in March 2022. Global trade remains a lasting transmission channel: EIA reports that in 2024, the United States exported about one-quarter of the distillate fuel oil it produced.
- Short-run utilization response: High crack spreads created a strong incentive to increase runs. Over the four weeks ending April 22, 2022, U.S. refiners processed nearly 15.8 mb/d, reaching nearly 91% utilization (94% on a seasonally adjusted basis, the highest since September 2018).
How do analysts read a 3-2-1 crack spread chart?
Reading a 3-2-1 crack spread chart requires checking whether the spread is positive or negative, verifying the exact crude and regional fuel benchmarks plotted, and separating predictable calendar seasonality from structural supply shocks. Confirming hub basis, fuel specifications, and seasonal transition dates prevents routine contract changes from looking like demand shifts.
A crack spread chart can turn either positive or negative depending on relative product prices. Negative readings typically appear in individual product spreads during weak demand or excess inventory periods, signaling pressure on refiners to trim runs or adjust yields. Before interpreting any chart movement, confirm three methodological details:
1. Crude benchmark and hub alignment
EIA warns that choosing different crude oil streams changes the level and trend of a crack spread. West Texas Intermediate (WTI) has historically reflected inland transportation bottlenecks at its main market hub, whereas Louisiana Light Sweet (LLS) moves closely with comparable-quality global crude streams. Similarly, pairing New York Harbor RBOB against Gulf Coast crude introduces regional transport basis that does not belong to a single refinery gate.
2. Product specifications and regional mandates
Modern U.S. futures benchmarks reflect specific regulatory definitions recorded by EIA:
- Gasoline (RBOB): Since 2006, the U.S. gasoline futures contract has tracked reformulated blendstock for oxygenate blending (RBOB)—the petroleum component prior to ethanol blending—rather than finished conventional gasoline.
- Distillate (ULSD): Since spring 2013, the distillate (heating oil) futures contract has tracked ultra-low sulfur diesel (ULSD) with sulfur content under 15 parts per million (ppm), replacing the earlier specification that allowed up to 2,000 ppm sulfur.
- Regional blend premiums: Los Angeles spot gasoline reflects California reformulated blendstock (CARBOB) rather than conventional blendstock (CBOB). California prices tend to trade higher due to cleaner-burning blend mandates requiring more processing steps, limited outside pipeline connections, reliance on in-state refineries, and state compliance programs.
3. Predictable calendar seasonality
EIA documents recurring annual shifts that move crack spread charts even without an unexpected refinery outage:
- March 1 summer gasoline step-up: Starting March 1, the front-month RBOB contract switches to a lower Reid Vapor Pressure (RVP) summer gasoline specification that costs more to refine, lifting RBOB prices and gasoline crack spreads through the U.S. summer driving season.
- September 1 winter gasoline reversion: On September 1, front-month RBOB reverts to a higher-RVP, lower-cost winter specification, and the gasoline crack spread declines to reflect the lower gasoline price.
- October-to-February distillate peak: Distillate consumption rises in the fall for Midwest agricultural harvesting and transport and in the winter for Northeast heating demand, keeping distillate crack spreads highest from October through February.
Table 4. Crack spread quote-unit and benchmark verification checklist for energy research notes. SRP Blog synthesis of cited EIA and Federal Reserve Bank of Dallas documentation.
Scroll horizontally to view all columns.
| Verification field | What to confirm before plotting or comparing | Common error prevented |
|---|---|---|
| Spread ratio | Confirm whether series is 3-2-1, 5-3-2, 2-1-1, or single-product | Comparing gasoline-heavy and distillate-heavy margin proxies as identical |
| Unit denominator | Verify per-gallon fuel quotes are multiplied by 42 (or crude divided by 42) | Mixing per-gallon and per-barrel units in the same subtraction |
| Scaling basis | Confirm total 3-barrel basket is divided by 3 for per-barrel reporting | Overstating per-barrel gross margin by a factor of three |
| Crude benchmark | Record exact crude grade and hub (WTI, LLS, or Brent) | Mistaking inland crude pipeline bottlenecks for refinery profitability |
| Product hub and grade | Record RBOB vs conventional/CARBOB, ULSD (<15 ppm), and NYH vs Gulf Coast | Confusing regional blend mandates or transport basis with national supply |
| Calendar window | Check March 1 / September 1 RVP switch dates and October–February distillate peak | Misreading routine specification shifts as structural demand shocks |
| Profit boundary | Keep operating energy costs, co-products, and crude quality separate from the spread | Treating a benchmark futures spread as reported refinery net income |
When pairing crack spread charts with weekly U.S. petroleum inventory series, verify survey scope and revision conventions using our guide to EIA natural gas and API weekly statistical data and the central data and sources directory.
Frequently asked questions
Why do analysts multiply RBOB and ULSD prices by 42 in the 3-2-1 crack spread?
Standard U.S. crude oil barrels hold 42 gallons, whereas wholesale RBOB gasoline and ULSD distillate contracts trade on a per-gallon basis. Multiplying per-gallon fuel quotes by 42 converts both refined products into per-barrel prices so all three legs share the same volume unit before subtracting crude oil.
Can a crack spread be negative?
Yes. EIA notes that crack spreads can turn positive or negative depending on relative wholesale product prices and crude oil costs. Negative readings occur when a specific refined product trades below the per-barrel value of crude oil during weak seasonal demand or excess local inventory.
Does a rising 3-2-1 crack spread guarantee higher refinery profits?
No. As the Federal Reserve Bank of Dallas and EIA both emphasize, crack spreads exclude non-crude operating costs—such as natural gas used for heat, electricity, and hydrogen—as well as co-product revenues and plant-specific crude quality differences. A rising spread signals stronger short-run incentives to increase refinery utilization rather than guaranteed net profit.
When should an analyst use a 5-3-2 crack spread instead of 3-2-1?
Use a 5-3-2 crack spread when evaluating refineries or seasonal periods with a higher share of distillate output. While 3-2-1 weights 2 barrels of gasoline and 1 barrel of distillate per 3 barrels of crude, 5-3-2 weights 3 barrels of gasoline and 2 barrels of distillate per 5 barrels of crude, reflecting diesel-oriented plants or heavier winter distillate demand.
Why does the gasoline crack spread tend to increase around March 1?
Starting March 1, the front-month RBOB gasoline futures contract transitions to a lower Reid Vapor Pressure (RVP) summer fuel specification that requires costlier refining and blending steps. That specification change, followed by rising summer driving demand, tends to lift RBOB prices and gasoline crack spreads until the contract reverts to higher-RVP winter fuel on September 1.
Continue the research
Related Research
Oil company profits: drivers, cash flow and capex
What drives oil company profits, and how can researchers trace them into capital spending?
EIA Natural Gas Data vs the API Weekly Statistical Bulletin: Storage Report Scope and Revision Rules
Which energy dataset answers a natural-gas research question, and how should its coverage and revisions be recorded?
Sources & Data Notes
-
3:2:1 formula, single-product vs multi-product ratios (5:3:2, 2:1:1), benchmark hubs, and margin scope.
-
RBOB (2006) and ULSD (2013, under 15 ppm sulfur) definitions, per-gallon spread basis, California CARBOB, 2024 distillate exports, and seasonal RVP timing.
-
Distillation boiling-point fractions, catalytic cracking, and hydrocracking overview.
-
42-gallon barrel standard, 6.3% processing gain, API gravity and sulfur effects, and 2023 average U.S. product yields.
-
Formal technical definitions of catalytic cracking and catalytic hydrocracking.
- Energy Indicators
Historical spring 2022 spread highs, distillate days of cover, U.S. operable capacity declines, utilization rates, coker vs FCC yield focus, and refiner profit boundary.
-
X:Y:Z ratio convention, 1994 NYMEX crack spread launch, 30,000-barrel crude, 20,000-barrel gasoline, and 10,000-barrel heating oil futures bundle, and OTC customization.